Market sentiment has fallen to its April low, the level seen on "Tariff Day," but Goldman Sachs's capital flows team believes that U.S. equity technicals are quietly shifting. The corporate buyback window will reopen on a large scale from late October through November, year-end selling pressure from mutual funds will ease after Halloween, and historic seasonal buying by retail investors and foreign investors will then take over—buybacks, retail investors, and foreign capital are all set to return almost simultaneously.
JPMorgan's latest research report points out that the current downturn in AI infrastructure stocks is significantly worse than the correction in July. Retail investors have so far failed to engage in "buying the dip," and, compounded by a sharp drop in share buyback activity, thin short positions, and relatively large leveraged ETFs, the technical support for this rally is far weaker than last time.
Retail investors remain on the sidelines, with no "buy on dips" signals in sight.
During the July rebalancing period, retail investors ramped up their purchases of Korean equities through both leveraged and unleveraged ETFs, resulting in a substantial inflow of capital.
 However, JPMorgan data show that since October, both overseas investors' purchases via leveraged ETFs and domestic investors' allocations through non-leveraged ETFs have been extremely limited. The report explicitly notes that there are currently virtually no signs of retail investors "buying the dip."
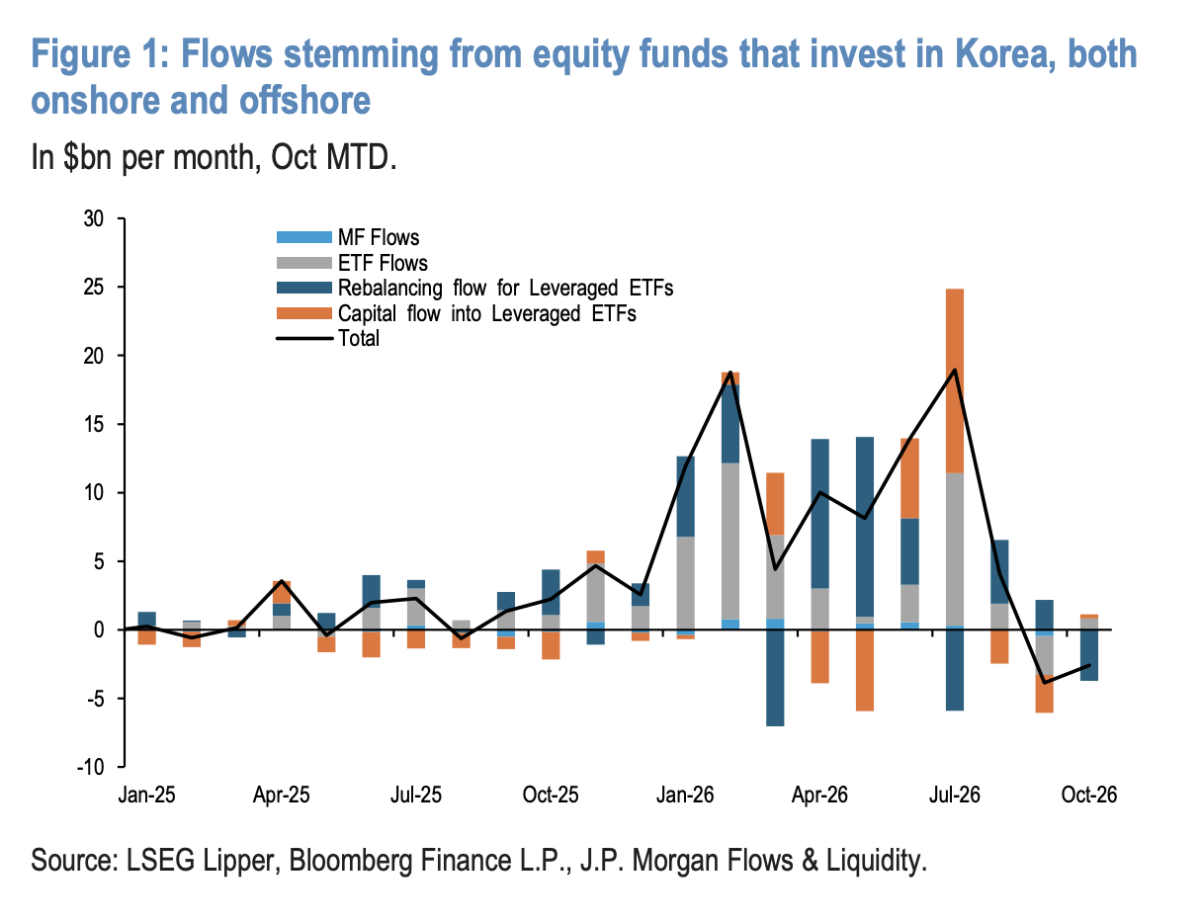
This divergence carries significant implications for market dynamics. In July, the active entry of retail investors provided crucial demand-side support; however, in the current correction, the absence of this force has substantially weakened the momentum for a natural price recovery.
Short interest is thin, making a short-squeeze rally hard to replicate.
Another key driver of July's market performance was large-scale short covering. At the time, the outstanding shares of EWY, the largest offshore ETF tracking the Korean stock market, surged by roughly 30% in July alone, largely to accommodate a sharp rise in short interest; subsequent short covering in August further fueled the equity rally.
However, JPMorgan data show that short interest in EWY has remained virtually unchanged since October. Moreover, short positions in U.S. storage stocks—including Micron, Sandisk, Western Digital, and Seagate—as well as in major semiconductor ETFs such as SMH and DRAM, are also at low levels.
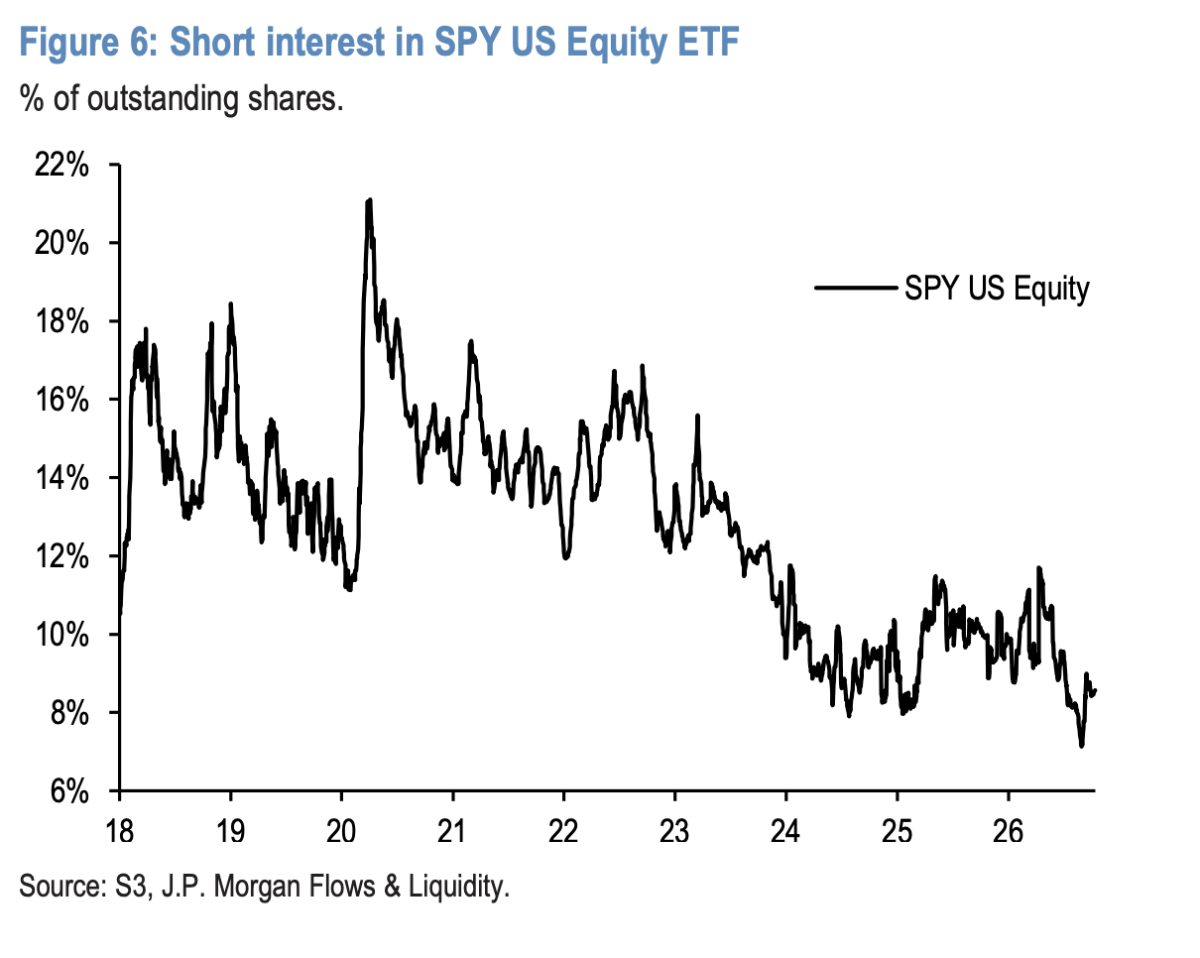
The report also notes that even short interest in the S&P 500 ETF—SPY, a U.S. equity index fund—is at historically low levels. The widespread lack of short positions suggests that this round of declines lacks the ammunition needed to spark a rally driven by short covering.
Leveraged ETFs remain at elevated levels, and the support from share buybacks is set to dry up.
JPMorgan also identified two other structural factors that are exacerbating current vulnerabilities.
First, the asset‑under‑management (AUM) ratio of leveraged equity ETFs to the market capitalization of their underlying stocks, after hitting a low at the end of July, has been steadily rising throughout August and September, now standing at roughly the 70th percentile between this year's April trough and June peak. This implies that, compared with late July, leveraged ETFs are currently larger in scale; consequently, should market volatility resurface, the passive deleveraging they trigger could exert more pronounced downward pressure on prices.
Second, there is a risk of a gap in share buyback activity. On August 20, 2026, two major South Korean memory‑chip companies announced a combined $40 billion stock‑repurchase program, originally scheduled to run through November 2026. However, due to an accelerated pace, the buybacks were effectively completed by mid-October. The disappearance of this supporting force was not present during the July correction, making it a unique headwind at present.
Bullish and bearish arguments clash! Goldman Sachs believes that the three major buying forces are about to make a concentrated comeback.
However, Goldman Sachs' capital flows team points out in its latest report, "Witching Hour," that what makes the market uneasy may恰恰 be a signal to enter. "In such a depressed sentiment and with such an uncertain macro outlook, it's unsettling to start looking ahead. But the technical picture of U.S. stocks is changing—this is hard to deny."
The firm believes that three major sources of buying are poised to return in unison: corporate share buyback windows will reopen on a large scale from late October through November; retail investors have historically maintained steady inflows during November and December; and foreign investors typically follow a pattern of historic net buying following midterm elections.
The buyback window has reopened, and November is the second-largest month for share repurchases of the year.
Corporate share buybacks are the first force poised to return.
Around September 15, approximately 40% of S&P 500 constituents entered their pre-earnings quiet period, effectively closing the corporate buyback window. Data show that buyback activity during this period was only 80% of the level recorded during the same period last year.
This window is reopening. Goldman Sachs expects companies to exit their quiet period one to two days after releasing earnings—about 10% of S&P constituents will re-enter the open window this weekend, and that share will rise to 48% by the end of October.
Larger buying activity occurred in November. Data show that November was the second-highest month of the year for corporate share repurchases, accounting for 10.1% of the annual total—trailing only August.
However, there is a marked divergence in buyback structures. The information technology sector still accounts for 46% of all buybacks executed, but this represents a 40% year-over-year decline; the financial sector saw an 88% year-over-year increase; while the energy and utilities sectors posted the most dramatic gains, up +480% and +538%, respectively—though together they comprise only 6% of the total.
The bank notes that tech companies hold substantial cash reserves, yet much of this liquidity is being channeled into GPUs and data centers rather than used to repurchase their own shares.
After Halloween, selling pressure from mutual funds subsided.
Coinciding with the resumption of share buybacks is a waning of selling pressure.
The firm dubbed late October a "terrifying sell-off season": 678 actively managed funds—accounting for $2.306 trillion in assets under management—and 81 passively managed funds—managing $1.736 trillion—ended their fiscal year on October 31, representing 23% of total AUM in actively managed funds—the largest single-month share of the year.
This means that tax‑driven year‑to‑date sell‑offs in loss‑making stocks will tend to peak around Halloween, but once the calendar turns, that supply pressure promptly dissipates.
Retail investor flows closely align with this timing. The firm notes that October ranks as the third-largest month for net outflows from equity mutual funds and ETFs, "with some tough challenges still ahead"; however, November and December are expected to see consecutive net inflows, second only to February and March in magnitude.
The latest data, as of the week ending October 7, show that global equity funds recorded net inflows of $12 billion, with technology funds attracting the largest share of capital, followed by utility funds.
Off-exchange funds should not be overlooked either.
As of the week ending October 7, money market funds saw a weekly net inflow of $166.37 billion, accounting for 1.49% of the total money fund assets, whereas the average weekly change over the previous four weeks was only -0.03%. Goldman Sachs commented:
Capital remains cautious and lacks conviction, as the macro backdrop is rife with uncertainty. Once the outlook becomes clearer, substantial off‑market liquidity will be poised to re-enter the market—historically, November and December have been the window when this capital flows back in.
Foreign Investors: The Overlooked 18%, Historic Buying After the Midterm Elections
Goldman Sachs's sentiment composite index (which aggregates positions of institutions, retail investors, and foreign investors) currently stands at -1.3. Historical data show that when this indicator is in the range of -1 to -1.5, the average return over the following month is +2%, constituting a "moderate tailwind."
Notably, CFTC futures positioning stands at the 95th percentile, while flows into active equity funds remain in the single-digit percentile, with the composite indicator hovering near the 10th percentile—futures longs are fully leveraged, and fund‑flow dynamics are virtually flat.
Foreign investors are the most underappreciated factor. They hold 18% of U.S. corporate equity, far exceeding the 2% held by hedge funds, yet their positions have remained below the 50th percentile since 2009.
Historical patterns show that after midterm elections, foreign investors engage in systematic buying, with inflows over six months amounting to roughly 1.75% of their AUM. Goldman Sachs has analyzed ten midterm elections since 1986: pre-election buying is virtually nonexistent, while post-election buying rises almost vertically and continues through the following spring.
According to this calculation: 1.75% multiplied by a 18% shareholding ratio, and then by the U.S. stock market's market capitalization of over $60 trillion, yields a foreign buying scale of approximately $190 billion over six months. Goldman Sachs characterizes these investors as "marginal buyers," who emerge just as the market is "seeking the next wave of incremental buyers."
The bank noted that Citadel strategist Scott Rubner had also turned bullish earlier, based on the belief that "buyers are about to return," which aligns closely with the Goldman Sachs fund-flow team's calendar logic.
CTA: Buyers on both ends of the bond market, with asymmetric downside risk for S&P.
The position structure of systematic strategy funds (CTAs), by contrast, presents a different picture.
The firm estimates that a 2-sigma bond rally would trigger roughly $37 billion in CTA long positions, while a 2-sigma bond sell-off would prompt about $23 billion in buying; by contrast, the S&P 500 tells a very different story— a 2-sigma advance would elicit only around $5.5 billion in longs, whereas a 2-sigma decline would spark approximately $45 billion in short-selling.
The good news is that CTA funds have cumulatively sold off roughly $81 billion in global equities over the past month, and their U.S. equity exposure now sits at only the 27th percentile over the past year, leaving room for further positioning. On the small-cap front, CTA short positions on the Russell 2000 have reached their highest level since 2023; should market rotation occur, this could serve as a potent catalyst.
Volatility has already been priced in.
Historically, volatility tends to contract markedly after midterm elections and then gradually decline through year-end.
But this year, the "compression" has already occurred ahead of schedule. With about a month remaining until Election Day, the one-month implied volatility of the S&P 500 stands at roughly 12, whereas historically, the average for midterm elections at this stage is close to 19–20; for the Nasdaq 100, it's around 17–18, with the historical average in the mid-20s.
The conclusion is that the options market is pricing in historically minuscule intraday volatility, reflecting a lack of conviction in either direction and "resulting in tail risk being mispriced." Last week, Charlie McElligott of Nomura reached the same conclusion, noting that equity‑index volatility stands at the 2nd percentile and implied correlations are at the 1.8th percentile, with "the market's only fear being the right tail."
Goldman Sachs is not a monolithic entity internally.
Of course, there are also divisions within Goldman Sachs.
Louis Miller, head of Goldman Sachs' custom equity basket, warned on October 4 that "with the midterm elections approaching, the outcome could be unfavorable for risk assets," while maintaining a bullish outlook on AI-related stocks outperforming the SPXXAI basket—contrary to the rotation logic favored by the capital flows team.
Michael Hartnett of Bank of America has outlined a concise midterm‑election scenario: if Republicans control the Senate and Democrats control the House, "political gridlock = Goldilocks," with U.S. stocks gaining more than 5%; by contrast, a Democratic sweep would likely trigger a roughly 10% sell‑off. Current market pricing assigns about a 65% probability to a Democratic sweep, suggesting that post‑election buying from foreign investors may first need to absorb a policy shock.
Editor/lambor