
Deutsche Bank, citing nearly a century of market data, reveals that October 27 has historically often marked the S&P 500's final low for the year, after which the "Santa Claus rally" typically begins in earnest.
The 2026 market trend closely mirrors the historical pattern of midterm election years: after hitting an all-time high in May, the index has remained largely flat for nearly five months. As the countdown to the November 3 election begins, a rare confluence of seasonal and electoral-cycle tailwinds is taking shape.
Deutsche Bank, citing nearly a century of market data, points out that October 27 has historically often been the date when the S&P 500 completes its final bottom for the year, after which it typically enters a one-sided upward trend toward year-end.
 According to the Chasing Wind Trading Desk, Jim Reid, Head of Global Macro and Thematic Research at Deutsche Bank, stated in his latest "Chart of the Day" (CoTD) report that, whether it is a midterm election year or not,$S&P 500 Index (.SPX.US)$The seasonal patterns all point to the same conclusion: around October 27 marks the year's final low, after which the "Santa Claus rally" begins to gain momentum. He wrote, "If history is any guide, today is often the moment when reindeer rouse their masters and the Christmas rally starts building steam."
Against the current market backdrop, the 2026 trend closely mirrors the historical pattern of midterm election years. On May 29, the S&P 500 hit a year-to-date high, with gains of roughly 11% since the start of the year; however, over the subsequent five months, it has largely stalled, posting cumulative gains of less than 1%. As the midterm elections on November 3 draw near, Deutsche Bank believes that favorable seasonal dynamics and the electoral cycle are converging in a rare and powerful synergy.
Seasonal Patterns Revealed by a Century of Data
The Deutsche Bank report, since 1928…$S&P 500 Index (.SPX.US)$Based on the trend, we analyze historical trajectories by plotting three curves: those for midterm election years, non‑midterm election years, and the overall mean.
The overall mean‑reversion path indicates that the S&P 500 typically reaches a near‑term peak around July 18, then edges higher to an annual high near September 2, before undergoing the customary autumn correction and posting a low around September 30. Following a brief rebound, it resumes its downward move and completes its final intra‑year bottom around October 27. Thereafter, in typical years, the index tends to follow a broadly one‑sided upward trajectory through year‑end.
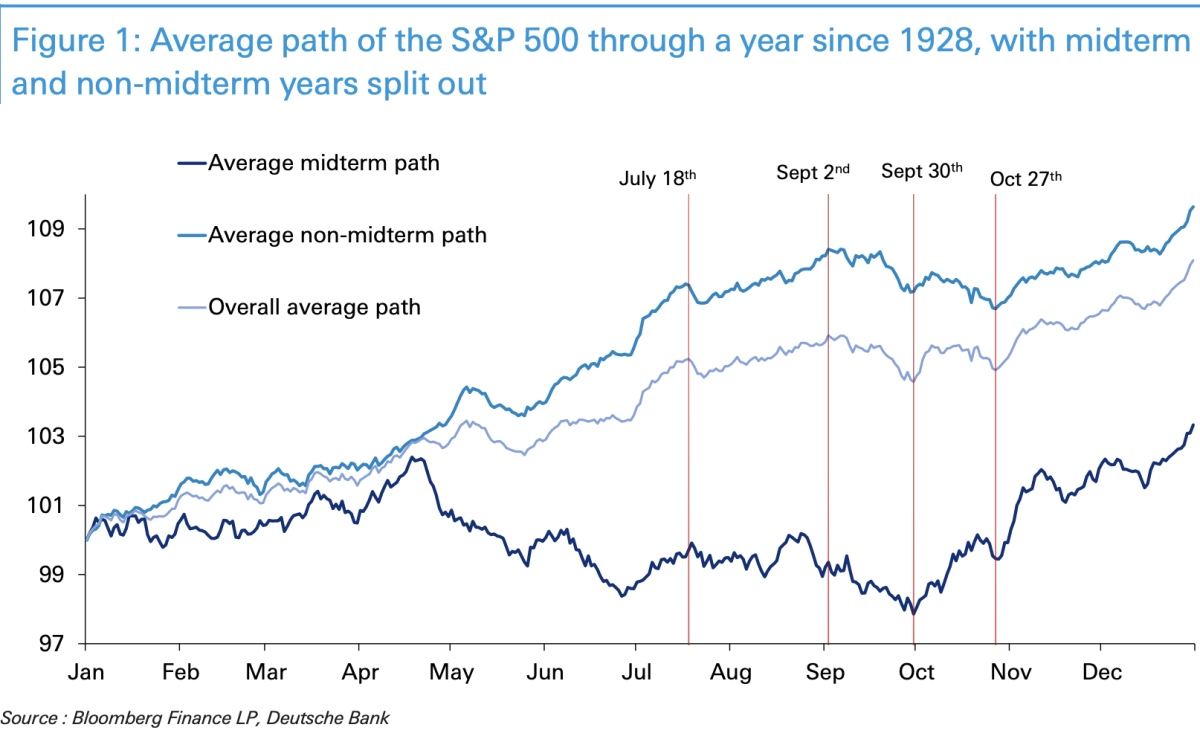
Jim Reid notes that this pattern also holds in midterm election years, albeit with a slightly different trajectory. In such years, the S&P 500 typically peaks in late April, then declines by roughly 4% to 5% as electoral uncertainty mounts, bottoming out in early October. Earlier, Deutsche Bank cited research by analysts Binky Chadha and Parag Thatte showing that, over the past 23 midterm election cycles, the S&P 500 posted gains in the three months following early October in 21 of those years—driven by fading uncertainty, the market's digestion of negative factors, the generally market‑friendly nature of political gridlock, and historically strong pre-election rally expectations.
The 2026 trend is highly consistent with historical patterns.
A Deutsche Bank report notes that the market trajectory in 2026 represents a "mild version" of the historical playbook for midterm election years.$S&P 500 Index (.SPX.US)$On May 29, it closed at an all-time high, up roughly 11% year-to-date; however, over the subsequent nearly five months, its gains have virtually evaporated, leaving it just under 1% higher than at the start of the year.
This period of stagnation is consistent with the typical pre-election pattern seen in midterm election years—markets tend to stall at the height of uncertainty, awaiting the post‑election repricing. With just one week remaining until the November 3 midterm elections, Deutsche Bank believes that the seasonal dynamics of midterm cycles are converging with year‑end seasonal trends, creating a rare double tailwind window not often observed in history.
Seasonal patterns are not foolproof, and risk factors should not be overlooked.
In its report, Deutsche Bank explicitly cautions that substantial individual variations lie beneath seasonal averages, and historical patterns do not necessarily dictate future outcomes. The report specifically cites examples such as 1962, 1974, 2002, and 2022—years in which midterm elections were followed by independent bear markets unrelated to the electoral cycle, with seasonal tailwinds failing to prevent sharp market declines.
Jim Reid also pointed out that the pressing concerns currently weighing on the market—such as the situation in Iran, the outlook for the artificial intelligence sector, and political risks in France—will not simply dissipate with the arrival of seasonal patterns. He emphasized that seasonal analysis offers only historical probability benchmarks and does not constitute investment advice; investors should make independent judgments based on their own circumstances.
Edited by melody