
U.S. stocks closed October with sharp volatility, as the Nasdaq 100 plunged 7% in the month and chip stocks posted their third-largest single-day drop in 15 years.
Goldman Sachs strategist Garrett has identified seven contrarian signals: hedge fund net exposure has fallen to historic bear-market levels, while the index has only retraced 3% from its peak; 80% of constituent stocks rose yet the index closed lower; and defensive stock valuations have climbed to the 90th percentile over the past decade. However, deleveraging is far from over—"We just need to get through 2026 first."
U.S. stocks closed October with a sharp bout of volatility. In his latest weekly report, Goldman Sachs derivatives strategist Brian Garrett identified seven key market "recovery" signals, arguing that current positioning and sentiment already provide grounds for contrarian buying—though he also acknowledged that the real test is yet to come: "We just need to get through 2026 first."
 $NASDAQ 100 Index (.NDX.US)$In October, the index fell by roughly 7% cumulatively, marking the second-worst monthly performance since the AI rally began in 2023 and triggering the third correction of the year. On Friday, chip stocks plunged 7% to 8% in a single day, posting the third-largest intraday relative decline in more than 15 years.$PHLX Semiconductor Index (.SOX.US)$After holding above its 200-day moving average for 355 consecutive trading days, it broke below that level on Friday and is now testing the July low.$S&P 500 Index (.SPX.US)$It fell 0.6% for the week, closing at 7,580 points.
However, Garrett noted that despite ongoing downward pressure on spot prices, "some contrarian indicators are emerging, suggesting that the current trend may exhibit certain corrective characteristics." According to Goldman Sachs' Prime Brokerage data, hedge funds' current net exposure levels have historically been associated with drawdowns exceeding 20%, whereas the S&P 500 has so far retraced only about 3% from its all-time high—this divergence itself constitutes a contrarian signal.
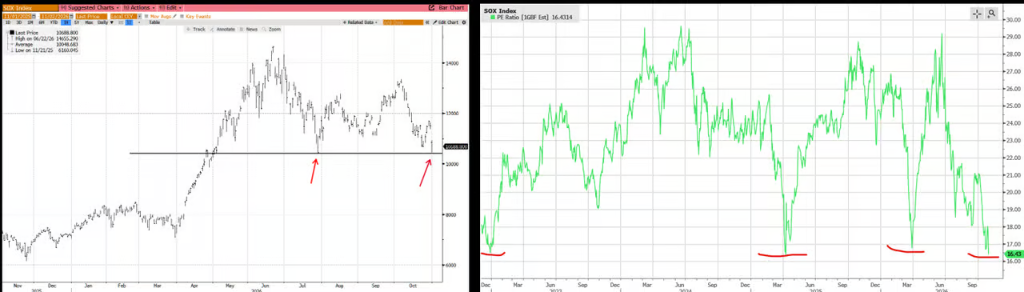
Chip stocks' 355-day record has come to an end, with valuations now back at the low point of the AI cycle.
Goldman Sachs TMT expert Peter Callahan pointed out,$PHLX Semiconductor Index (.SOX.US)$On Friday, the market closed below its 200-day moving average, ending a streak of 355 consecutive trading days above that level—the third-longest run of sustained strength in the past decade. It is currently retracing toward July's lows. Meanwhile, the semiconductor sector's forward price-to-earnings ratio has fallen to around 16 times, hitting the valuation trough of this AI cycle.
What triggered this round of sharp sell-offs was a busy week of earnings reports—Callahan believes that the relevant data points "to some extent exhibit signs of an inflection in growth," but he stresses that these signals "all originate outside the AI core ecosystem," and cites…$Amazon (AMZN.US)$Provide AWS's revenue visibility for the next two years as supporting evidence.
The next day, the reaction was even more pronounced:$ServiceNow (NOW.US)$Down 25% in a single day,$Intel (INTC.US)$Down 30%,$Reddit (RDDT.US)$Down 30%,$F5 Inc (FFIV.US)$Down 20%, with many individual stocks posting their worst-ever post‑earnings performance. Callahan attributes this to crowded positions, a compressed earnings‑report calendar, and ongoing structural headwinds in the sector.
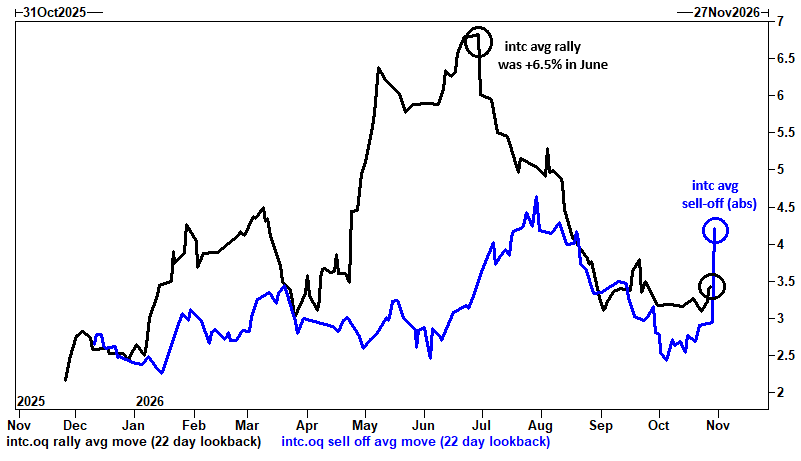
Garrett further pointed out that the direction of market volatility has shifted—stocks "are no longer surging upward." Taking Intel as an example, its average daily gain reached 6.5% in June this year, whereas its current average daily decline has already surpassed its average gain. Semiconductor ETFs and QQQ are following the same pattern: on down days, the average amplitude once again exceeds that of up days. In Garrett's words, stocks are "returning to behaving like stocks—downward volatility is far more extreme than upward volatility."
Implied volatility has caught up, but Gamma remains unchanged.
The first contrarian signal Garrett identified is that, at the macro level, equity implied volatility has finally begun to catch up, closing the gap with single-stock volatility and the credit market, which had already fully priced in panic.
Goldman Sachs' derivatives team's weekly report shows that,$NASDAQ 100 Index (.NDX.US)$In a single trading day, one-month implied volatility surged by nearly two volatility points, and clients' positioning shifted for the first time, with increased buying of downside protection on the index and changes in the flow of put options on the semiconductor sector.$S&P 500 Index (.SPX.US)$During the session, it briefly fell below the mid-term CTA (trend-following strategy) threshold.$Invesco QQQ Trust (QQQ.US)$The degree to which realized volatility has deviated from implied volatility ranks among the most pronounced one-off events of the past year.
Volatility of volatility also surged in tandem: the VVIX hit an intraday high of 124, its highest level since the outbreak of a specific geopolitical conflict, before easing somewhat. On Friday, U.S. stock options recorded nearly 100 million contracts traded in a single day, marking the fourth-highest daily volume on record.
The only one holding steady is Gamma. Garrett noted, "Despite the index's substantial intraday volatility, the pricing of 0DTE straddle options has shown no noticeable reaction." Taking the S&P 500 as an example, the cost of straddle options—factoring in both Apple's earnings report and the midterm elections—stands at just 150 basis points—below Friday's 180-basis-point intraday decline. On the year-end directional implied volatility front, the S&P 500 stands at ±5.1%, the Nasdaq 100 at ±7.8%, and the Russell 2000 at ±6.3%, with large-cap volatility once again outpacing small-cap volatility.
Hedge fund net exposure has reached "bear-market levels," yet the index has not fallen.
The second contrarian signal comes from Goldman Sachs Prime Brokerage data: hedge funds have net-bought U.S. stocks for the first time in four weeks (+1.1 standard deviations), but 73% of these purchases were in macro products and were largely short-covering—short positions in U.S.-listed ETFs fell by 4.8%, marking the largest weekly reduction in over six months, led by technology, large-cap equity, and credit ETFs.
Although technology was the sector with the largest net purchases this week, according to Goldman Sachs' prime brokerage team, these buys (as of Thursday) amounted to only about 40% of the sell-offs over the past three weeks. The "Mag 7" have seen net selling on four of the past five trading days, "indicating that risk appetite has hardly improved in any meaningful way."
Notably, Garrett points out that Mag 7 remains one of the few sectors within the TMT space where positions continue to accumulate, with long positions still near year-to-date highs—while the market is selling off tech stocks, it appears reluctant to part with the segment that holds the most concentrated holdings.
The more critical data point is that the U.S. fundamental long‑short net leverage ratio has fallen to 47%, placing it at the 7th percentile over the past year. After regressing this metric against S&P 500 drawdowns, Garrett found that such a level of net exposure has historically correlated with drawdowns exceeding 20%—while the index is currently down only about 3% from its all‑time high. In other words, hedge funds are already positioning themselves in anticipation of a "bear market that has yet to materialize," which in turn provides a compelling contrarian rationale for bullish bets.
80% of the constituent stocks rose, yet the index closed lower: "Defensive stocks are very expensive."
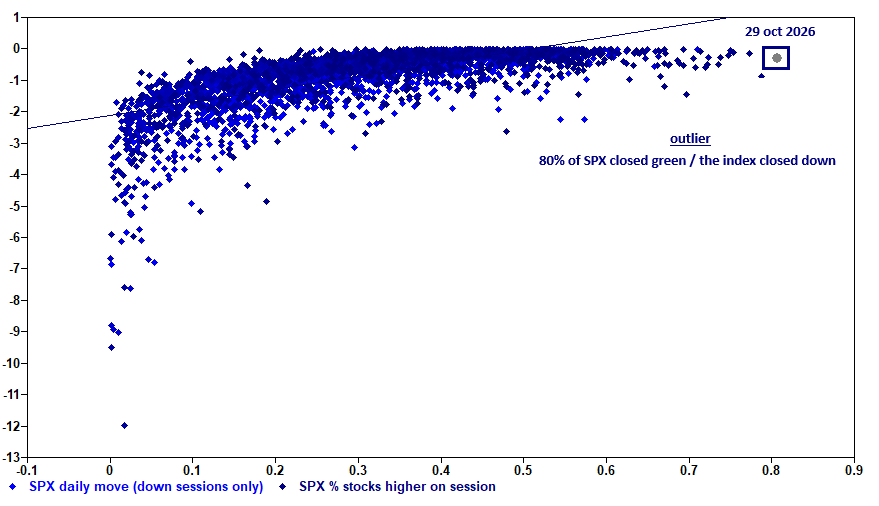
The fourth and fifth signals come from the market's internal structure. On Thursday,$S&P 500 Index (.SPX.US)$With 406 constituent stocks closing higher, marking one of the highest single-day proportions since 2026, the index still ended the day lower. Garrett plotted a scatter chart comparing all down days to the percentage of advancing stocks on each day; on Thursday, the data point stood apart—80% of constituents advanced while the index declined, an almost unprecedented occurrence in historical terms.
Behind this lies the ongoing divergence between AI and non-AI stocks: Goldman Sachs' AI‑winning portfolio continues to face pressure, while the S&P 500 excluding the AI sector (S&P ex-AI) is on track to post its best monthly performance since 2022 this month. Meanwhile, U.S. Treasury bonds ($iShares 20+ Year Treasury Bond ETF (TLT.US)$) The two-week correlation with the AI Winners portfolio stands at around -0.7, near the lower end of its range over the past two years, reflecting the classic safe-haven pattern of "AI down, bonds up."
On the valuation front,$S&P 500 Index (.SPX.US)$Year-to-date, the cumulative gain stands at 10.7%, yet forward P/E ratios have retreated to their lowest levels since 2026, around 19x—meaning that as the index rises, valuations are "catching up" to earnings, signaling a contrarian setup. However, "defensiveness has become expensive": the dividend yield factor is at the 90th percentile over the past decade, and the valuation factor at the 80th percentile, while the momentum factor remains only at the 30th percentile and the growth factor at the 40th percentile. Meanwhile, the low‑volatility index's forward valuation multiples have expanded to levels typically seen in growth stocks.
Callahan wrote that conversations about "broadening the portfolio" are on the rise, but "easier said than done"—trading days led by non‑AI sectors often leave investors feeling uneasy, as if their positions are being unwound, and it remains difficult to identify genuine non‑AI stocks that are truly insulated from the AI‑disruption narrative. He cited several individual stocks that currently appear promising:$Apple (AAPL.US)$、$Synopsys (SNPS.US)$;$Analog Devices (ADI.US)$/$Texas Instruments (TXN.US)$/$NXP Semiconductors (NXPI.US)$;$Spotify Technology (SPOT.US)$, V/MA,$eBay (EBAY.US)$and$Live Nation Entertainment (LYV.US)$。
Apple hits a record-high valuation, with mid-term election discount pricing.
This week, market catalysts are highly concentrated:$Apple (AAPL.US)$After-hours earnings reports on Monday,$Advanced Micro Devices (AMD.US)$and$Arista Networks (ANET.US)$On Tuesday, earnings reports; on Tuesday, the midterm elections (with Kalshi assigning a 65% probability of a Democratic sweep); on Wednesday, Treasury refinancing details (QRA); and on Friday, the nonfarm payrolls report (which came in at +29,000 last month). The S&P 500's implied volatility for the week stands at 1.84%.
Callahan is focusing on five individual stocks. Apple has reached a record-high absolute valuation, with a forward price-to-earnings ratio of 36 times, trading at a 17-times premium to the S&P 500—making it the last stock still regarded as a safe-haven asset.$SSE Mega-cap Index (000043.SH)$The stock, also the most expensive in history, is a testament to the logic that "defensiveness comes at a price."
On the midterm elections, Garrett expects they "won't be an event" for the broader index, but views them as a prime opportunity for thematic‑basket strategies. He singles out one particularly compelling pair trade: going long on renewable energy and grid‑related stocks while simultaneously buying downside protection in the hyperscale data center and data‑center equipment sectors—"who's going to foot the bill for data center power?" he asks, calling it the "most undervalued election‑sensitive theme" in U.S. equities.
The last two signals: AI financing expectations have reversed, and retail investors are starting to "ask questions before buying."
Garrett's last two reverse signals were relatively mild. Sixth: Credit market experts have begun to suggest that AI‑related financing demand may fall short of expectations. If hyperscale cloud providers reduce their reliance on the bond market, it could help ease market anxieties—though "it will take time to materialize."
The seventh point is one that Garrett finds particularly compelling: the behavior of his college classmates and his father-in-law has begun to send warning signals—this group has shifted "from unconditionally buying on dips to at least asking a question before making a purchase." Garrett believes retail investors are on the cusp of an "agent‑driven transformation," citing an advertisement that, during the brief window when children are out trick-or‑treating, promises to "set up your agent‑based options strategy in just 7 minutes."
Overall, Garrett believes that positioning‑level signals support a correction: net exposure has already retraced more than 20% from its historical peak, there are panic‑induced anomalies in market breadth, defensive stocks are severely overvalued, and retail investor sentiment is wavering. However, capital flows suggest that deleveraging is far from over: trading desks are still selling tech stocks, Mag 7 long positions remain near year‑to‑date highs, CTA systems are about to trigger a new round of short‑selling signals, and the options market's pricing for the confluence of Apple's earnings report and the midterm elections is even lower than Friday's single‑day realized volatility cost. As for 2027, the options market has priced intra‑index correlations at around a 20% historical low—by then, the index may remain virtually unchanged, while conditions inside it could be in complete turmoil.
Edited by melody