Executive Summary
Since October, gold prices have weakened rapidly despite no significant reduction in ETF holdings, a sharp decline in U.S. Treasury yields, and fluctuating U.S. dollar levels—a trend that clearly contradicts traditional patterns. What are the potential drivers behind this "anomalous" weakness in gold prices, and how might the gold market evolve going forward? For your reference.
I. Hot Topic Reflection: Is Gold No Longer a Safe Haven?
(I) What are the "anomalies" in the recent decline of gold prices? U.S. Treasury yields have fallen and gold ETFs have increased their holdings, yet gold prices have still plummeted.
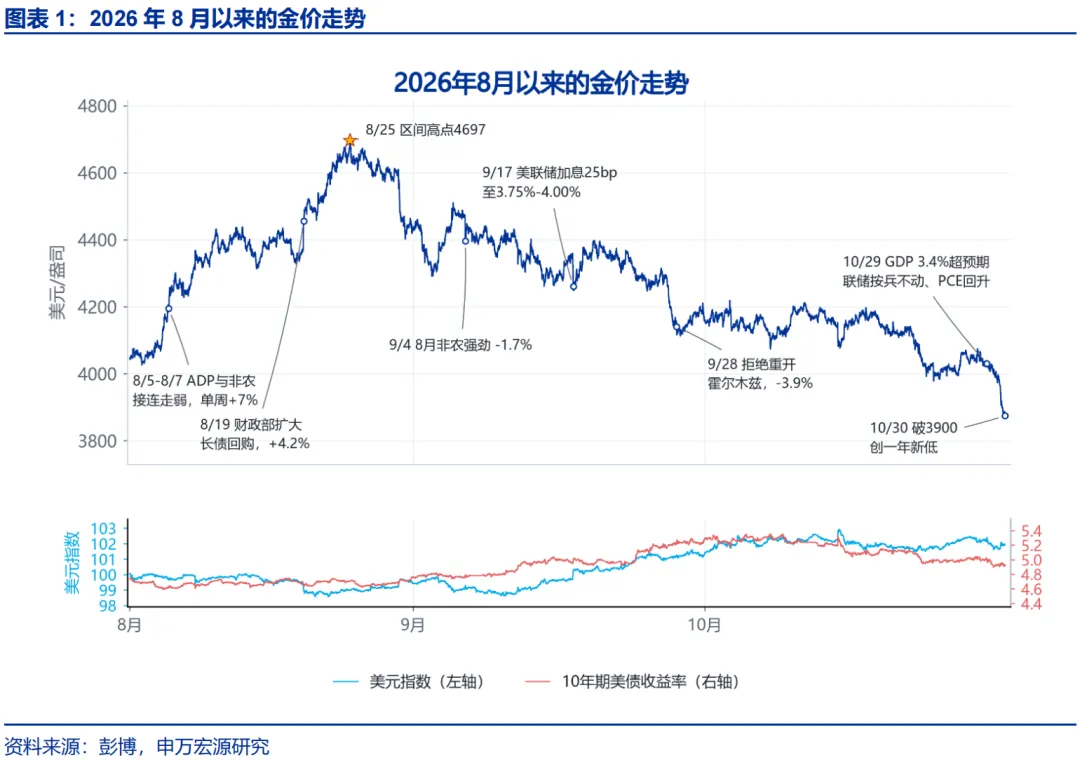
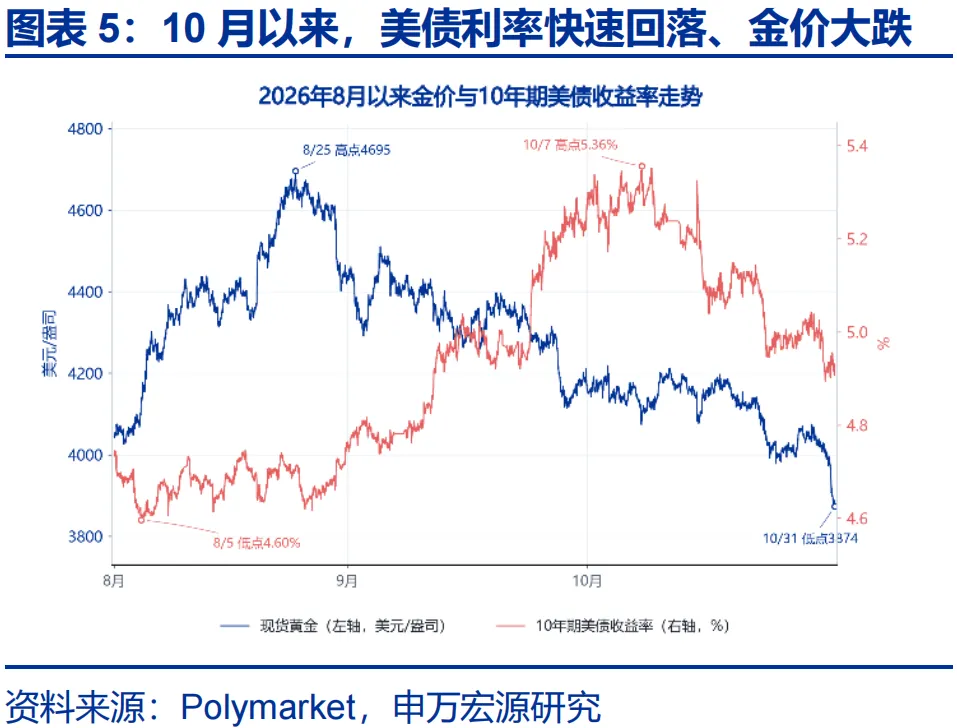
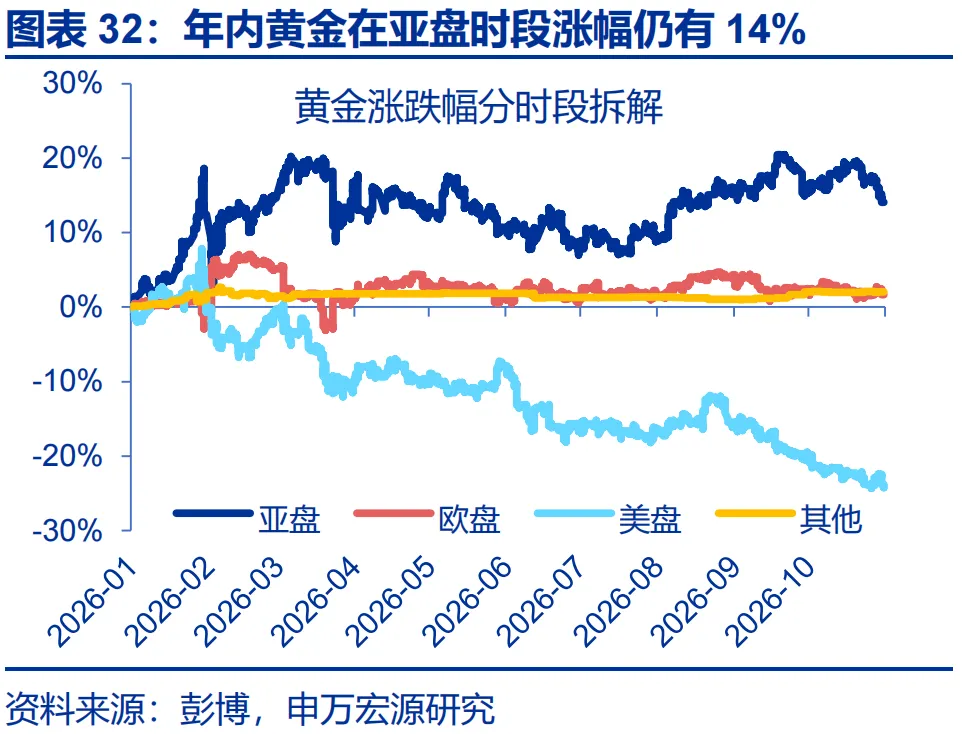
 Since August 25, gold prices have fallen rapidly, dropping below USD 3,900 per ounce on October 30 to hit a new low for the year. This round of declines can be roughly divided into three stages: 1) From August 25 to September 29, gold prices continued to fall against the backdrop of the Federal Reserve's hawkish shift; 2) From September 30 to October 21, gold prices consolidated with sideways fluctuations; 3) Since October 22, gold prices have accelerated their decline as Asian and U.S. trading sessions weakened in tandem.
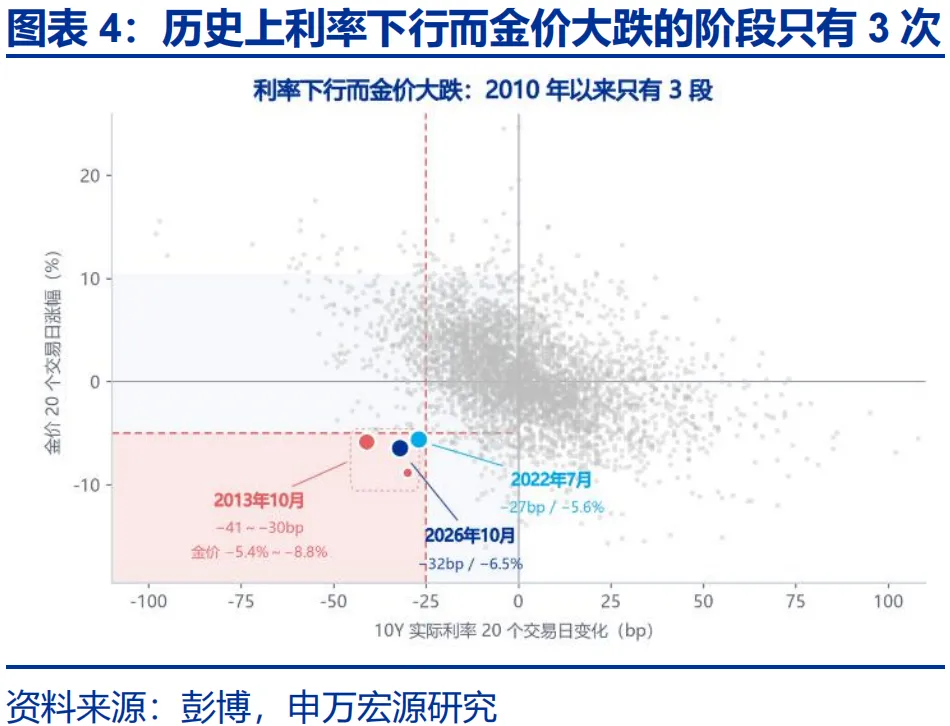
There are two major "anomalies" in this sharp decline in gold prices: First, the significant drop in gold prices since October occurred against the backdrop of a rapid decline in the real yield on 10-year U.S. Treasury bonds. Historical reviews show that only in October 2013 and July 2022 did gold prices fall by more than 5% while the real yield on U.S. Treasuries dropped by more than 25 basis points. At those times, rapid selling of gold ETFs was a key driver of the price decline.
Second, global gold ETFs did not reduce their holdings, yet gold prices experienced a sharp decline. Historical reviews indicate that only in March 2015 and May 2022 did gold prices fall by more than 8% while gold ETFs were simultaneously increasing their holdings; a sharp rise in the U.S. Dollar Index was the common driver in both instances. The simultaneous occurrence of a sharp drop in gold prices, a decline in U.S. Treasury yields, and an increase in gold ETF holdings has only happened in this current cycle, during which the U.S. dollar has merely fluctuated.
(II) What are the potential drivers behind the "anomalous" weakness? The "spillover effect" of sharp equity market declines and expectations of a "revival" in U.S. dollar credibility.
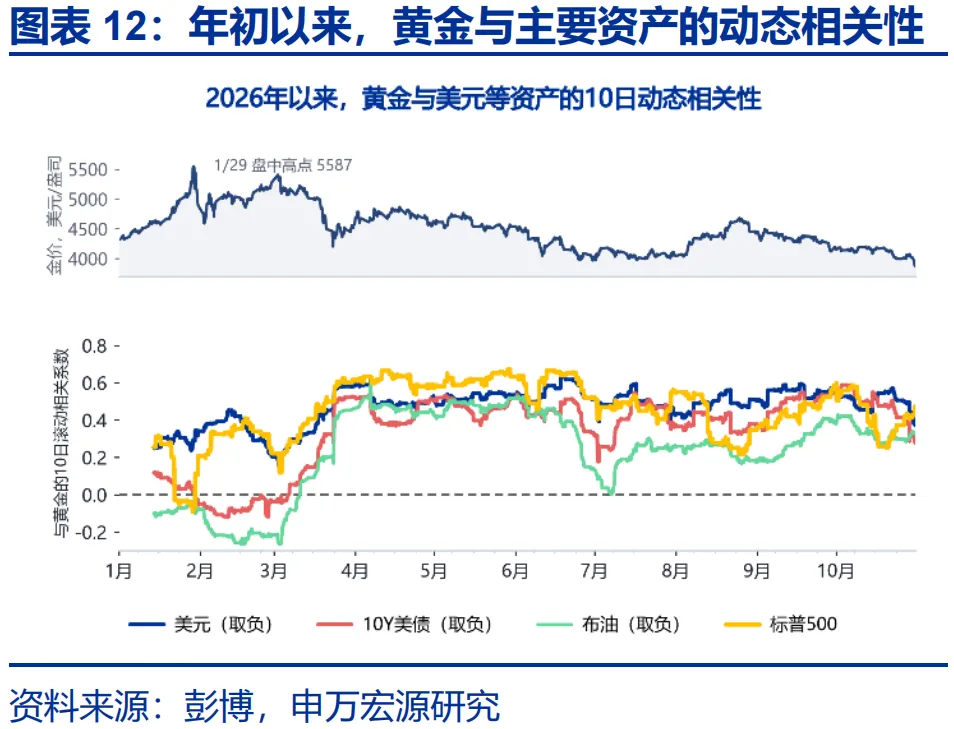
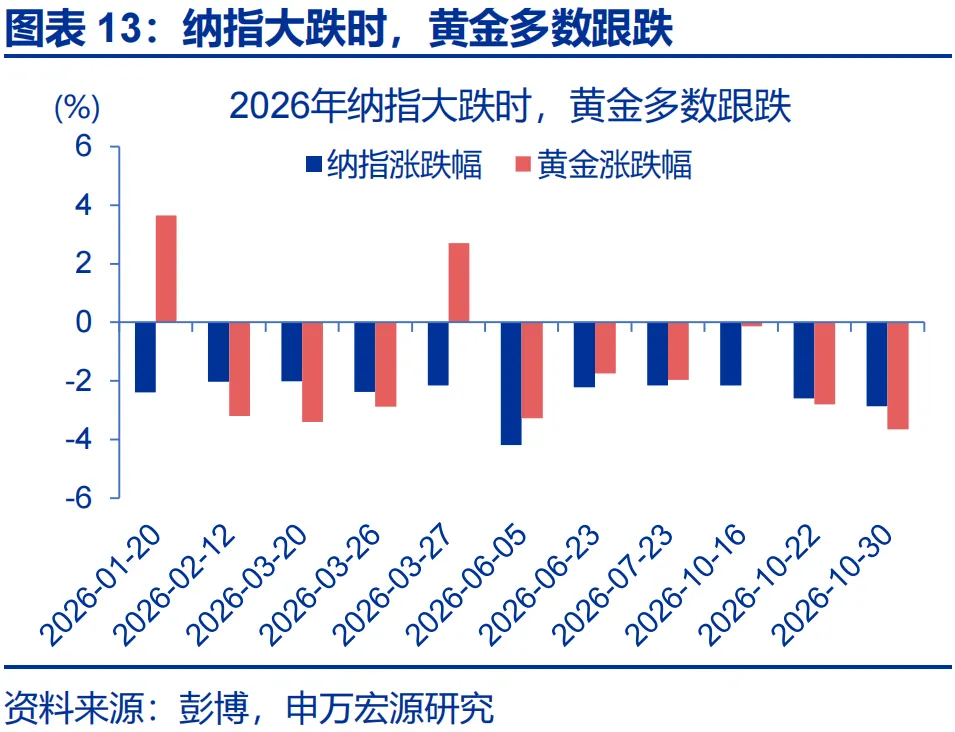
First, the "spillover effect" from sharp declines in equity markets may be a significant driver of gold's weakness since late October; this is primarily reflected in dimensions of "volatility spillover" and sentiment shock. Since April, the correlation between gold and U.S. equities has remained at a high level, exceeding that with U.S. Treasuries, the U.S. dollar, and Brent crude oil. Within the year, the Nasdaq Composite Index experienced 11 single-day drops of more than 2%, and in 8 of these instances, gold prices also fell by more than 1.7% on the same day.
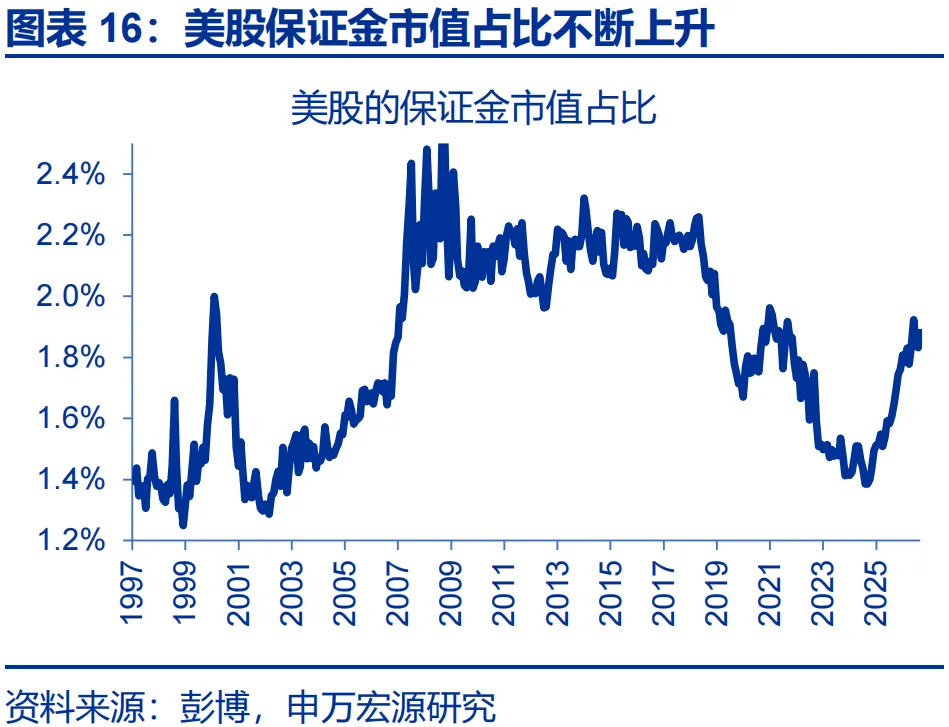
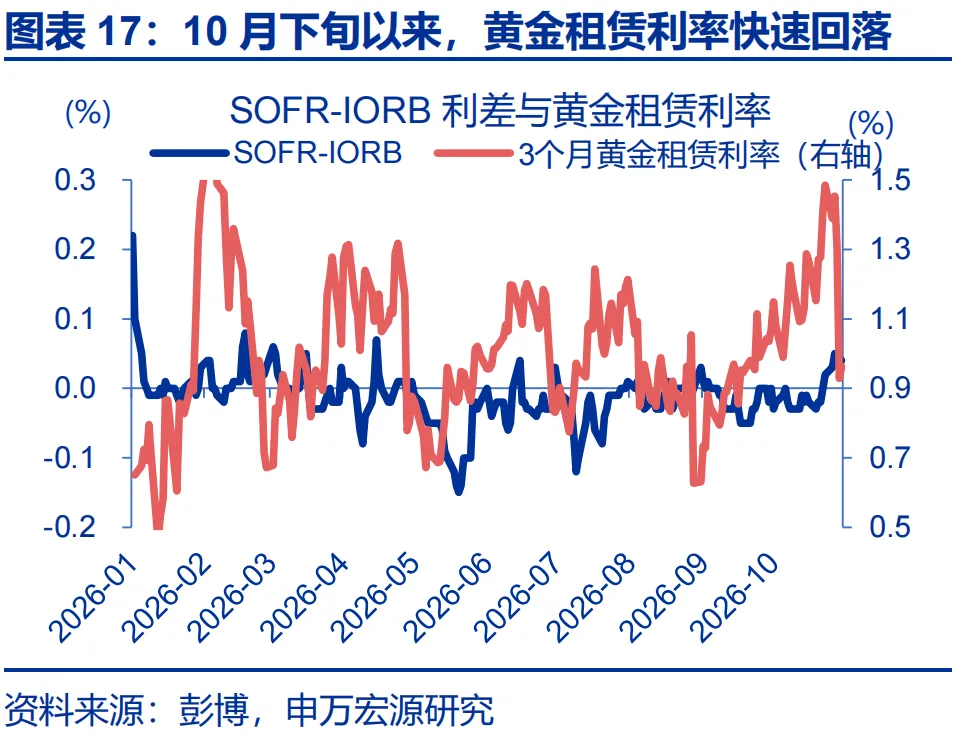
Secondly, equity assets may have also influenced the decline in gold prices through the spillover of "liquidity shocks." When sharp declines in equity markets cause liquidity shocks for some institutions, investors may seek liquidity through methods such as gold collateralized leasing or selling off assets for cash. Since October 22, the 3-month gold lease rate has rapidly decreased by 45 basis points, while the SOFR-IORB spread has risen by 4 basis points.
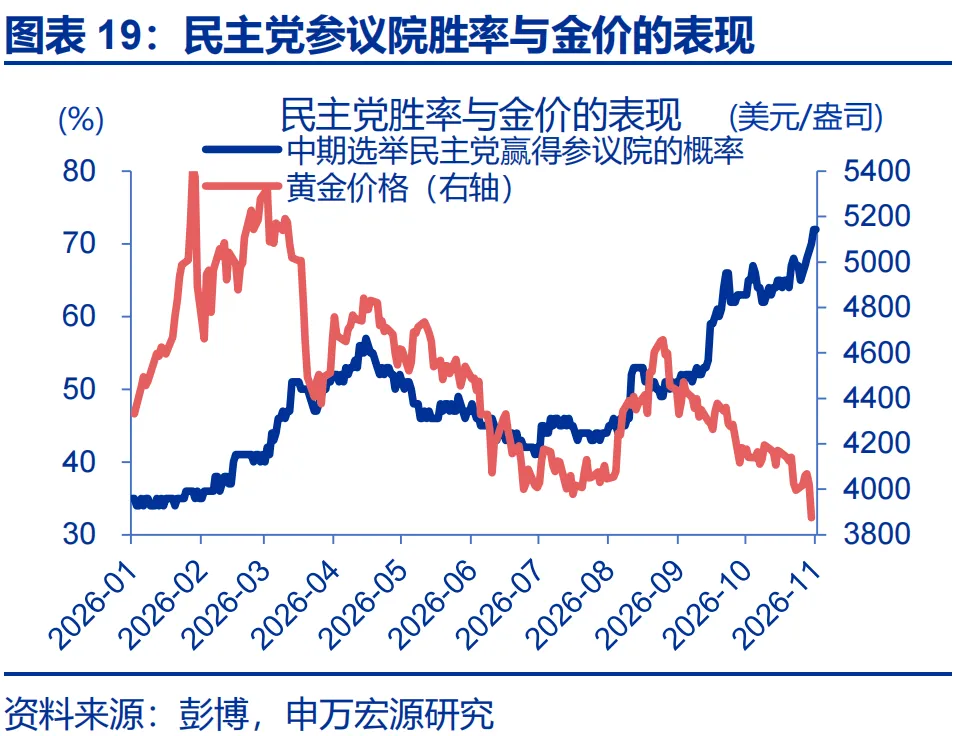
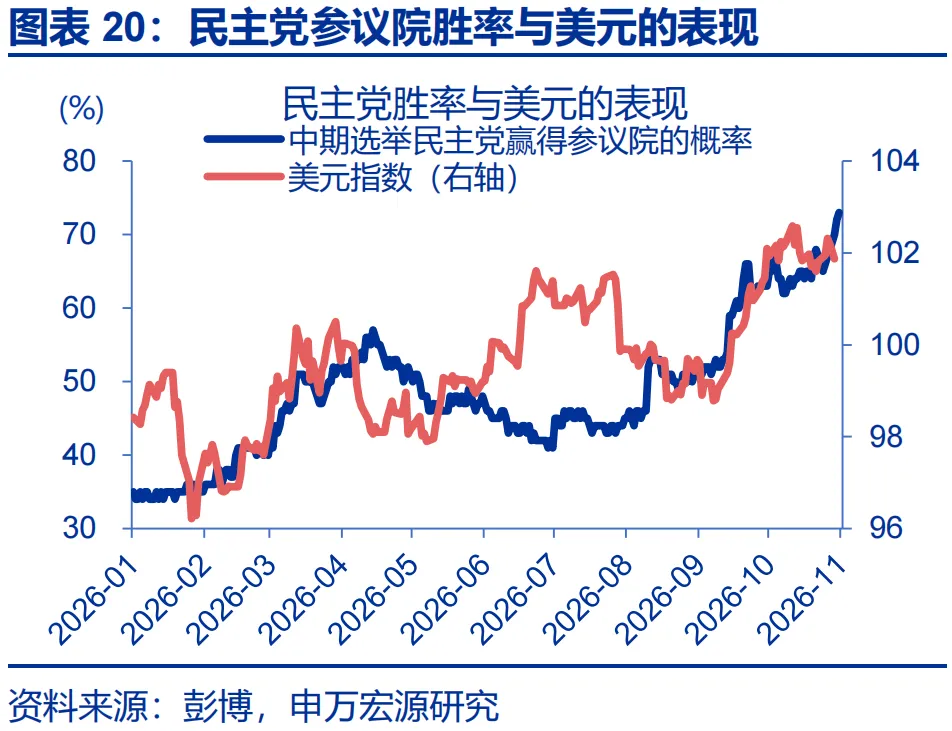
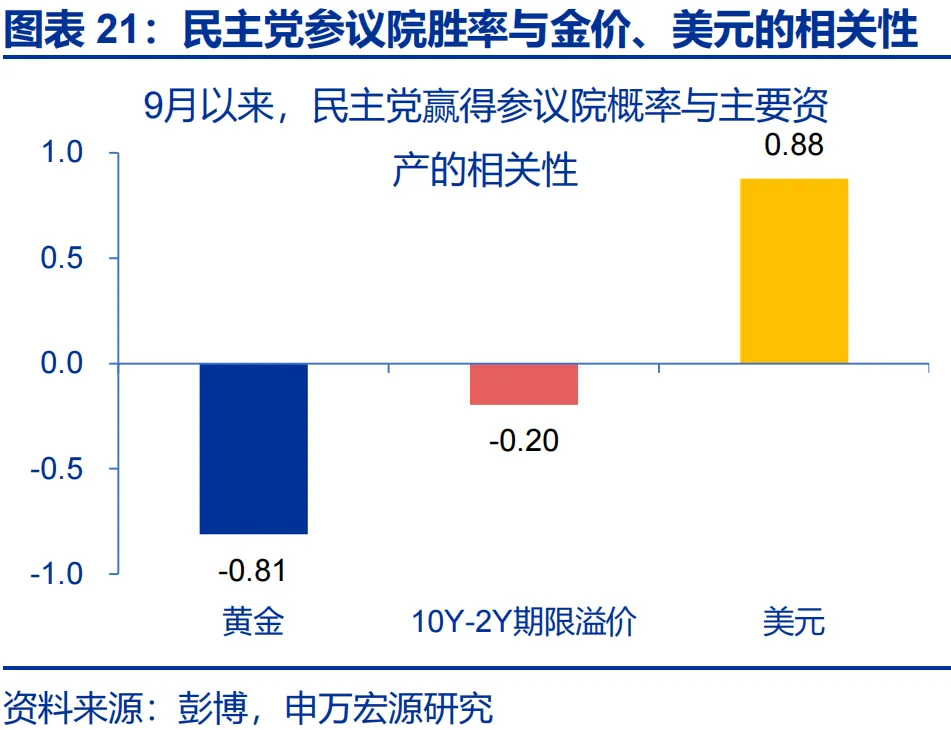
Second, economic resilience, the reshaping of Federal Reserve independence, and the recently intensifying expectations of "U.S. fiscal consolidation" may have somewhat revitalized confidence in the U.S. dollar, exerting certain pressure on gold. Since September, the probability of Democrats winning the Senate has shown a negative correlation of up to 0.81 with gold prices and a positive correlation of up to 0.88 with the U.S. dollar, which may partially substantiate the narrative regarding "U.S. dollar credibility."
(3) Looking ahead, when will gold "stabilize"? Short-term downward pressures may ease marginally, but medium-term risks such as accelerated rate hikes may still need to be cleared.
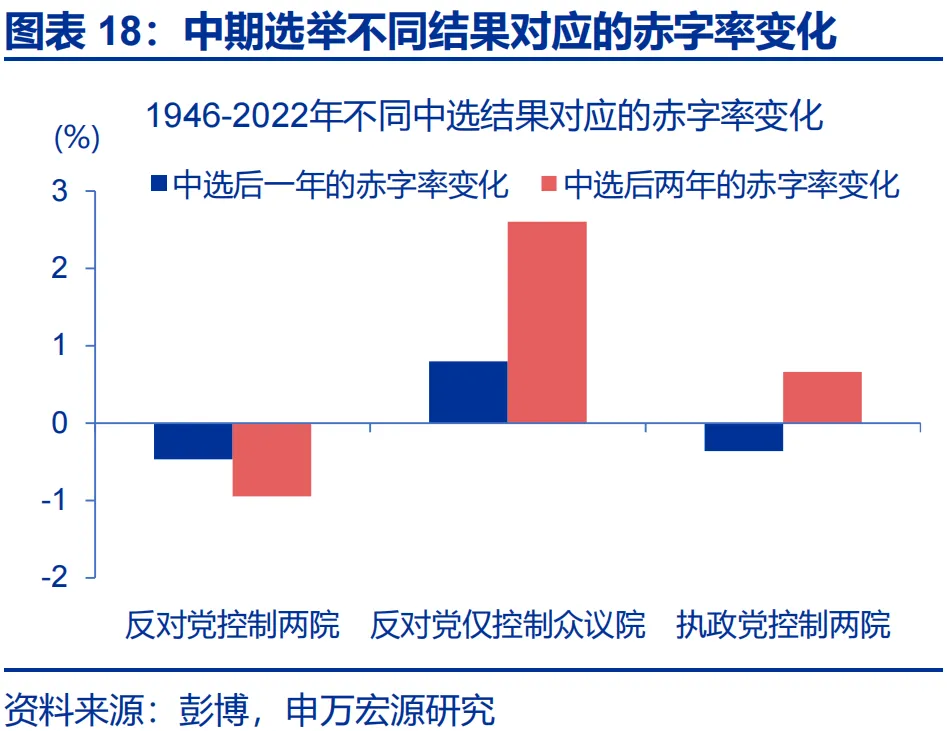
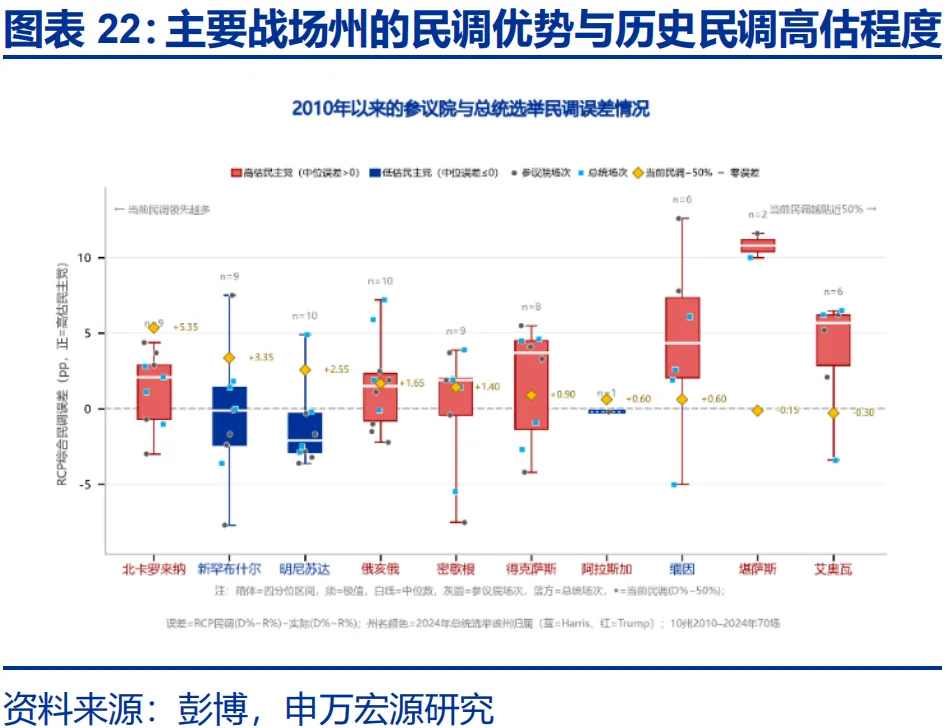
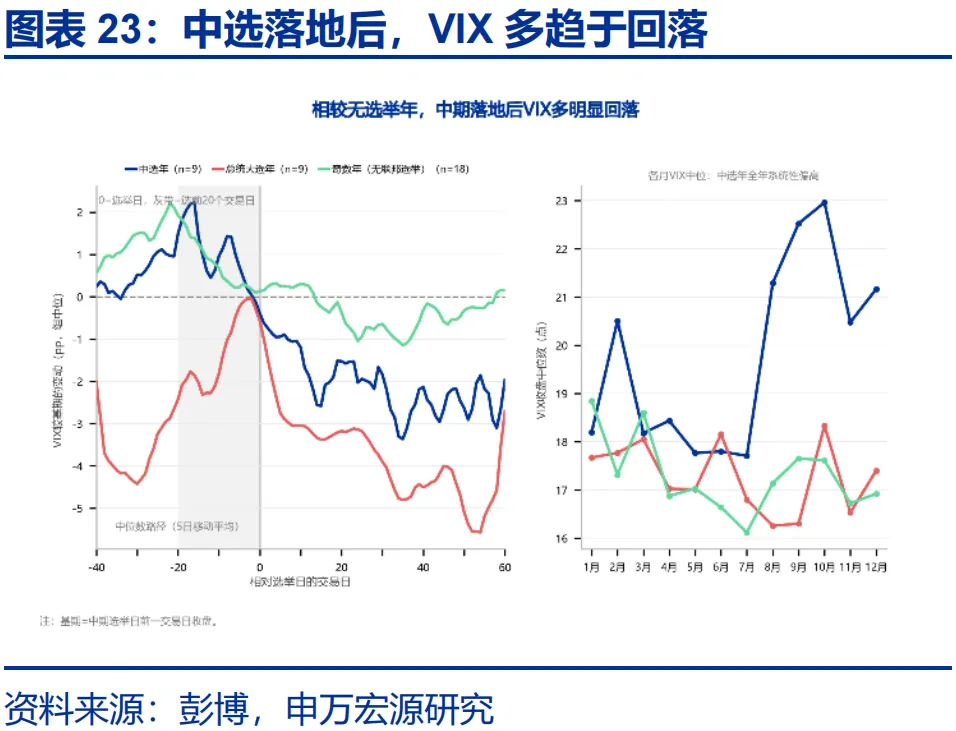
In the short term, as the midterm elections, U.S. stock Q3 earnings reports, and the Treasury Borrowing Advisory Committee (TBAC) meeting unfold, factors that previously weighed on gold may ease marginally. 1) Polls tend to overestimate the Democratic Party's chances of winning, and the implementation of "fiscal consolidation" faces significant obstacles. 2) With the conclusion of the midterms and the end of the U.S. stock Q3 earnings season, market volatility is likely to decline. 3) The TBAC meeting may reignite market concerns regarding long-term U.S. Treasuries.
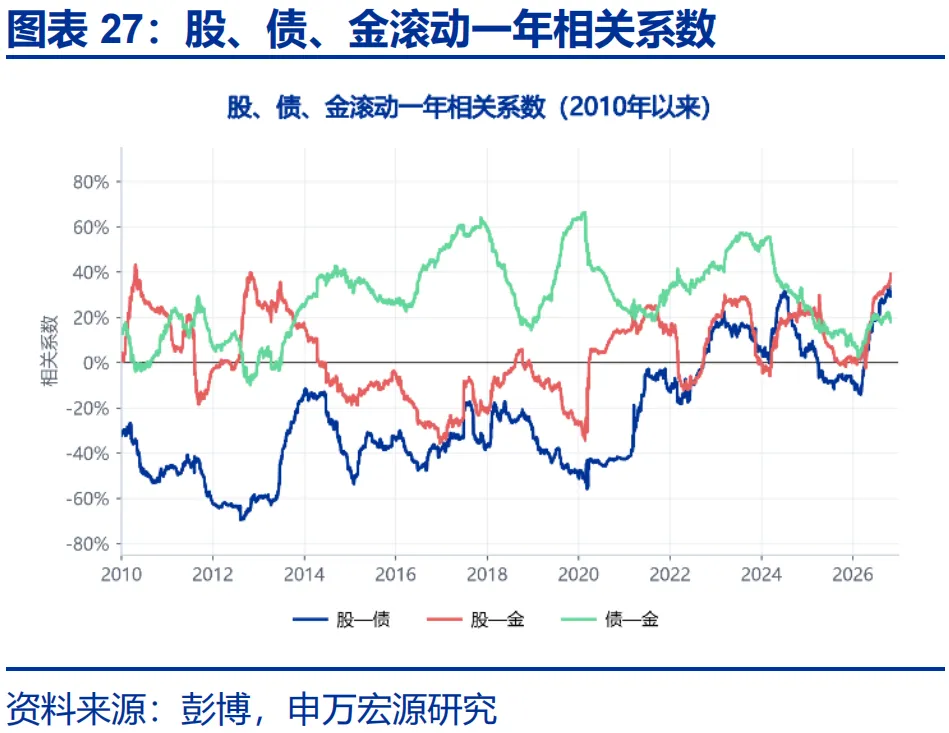
However, in the medium term, uncertainties surrounding the interest rate hike path and potential risks arising from the high positive correlation between equities and gold remain. 1) Given sticky inflation and economic resilience, the risk of multiple rate hikes in the medium term may continue to weigh on gold. 2) Currently, the one-year rolling correlation between equities and gold has reached a nearly 10-year high: this high correlation may cause equity volatility to spill over into gold, thereby affecting gold's hedging value within portfolios.
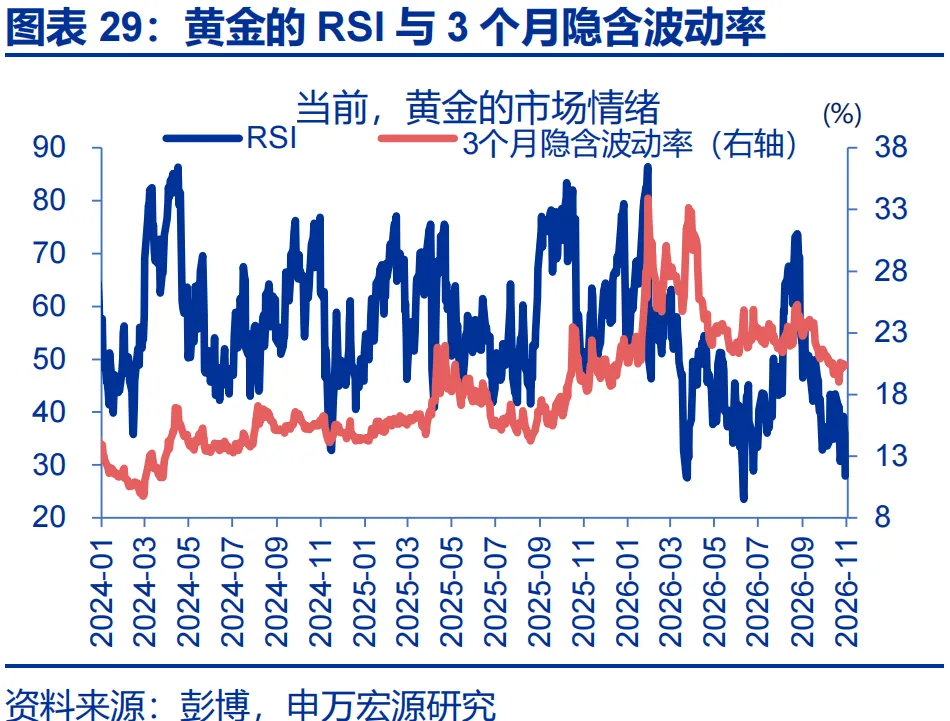
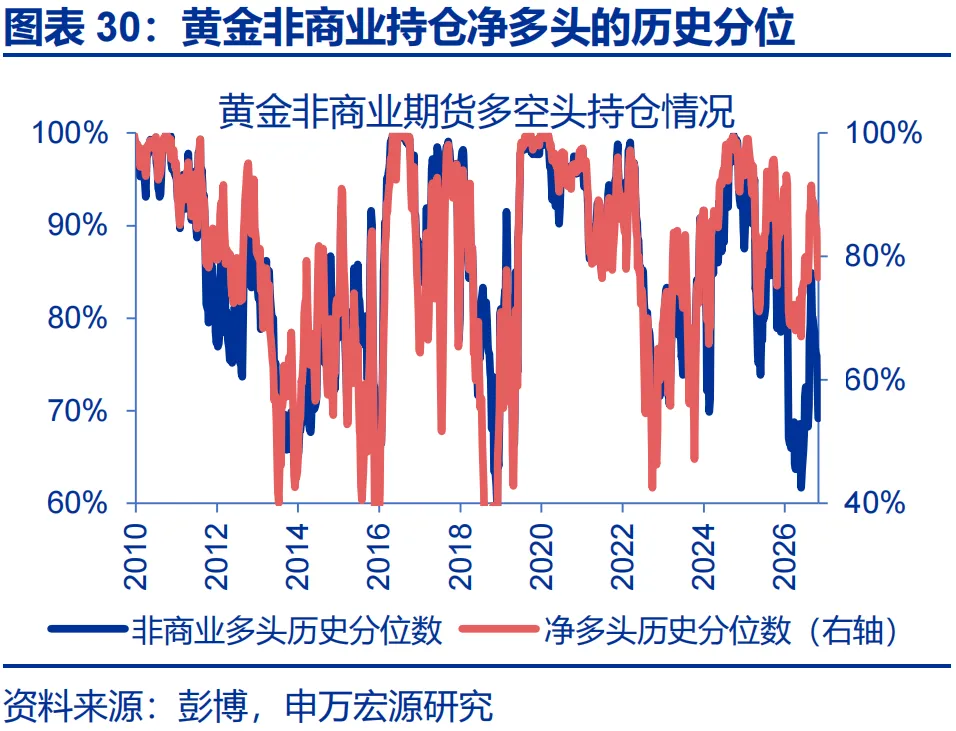
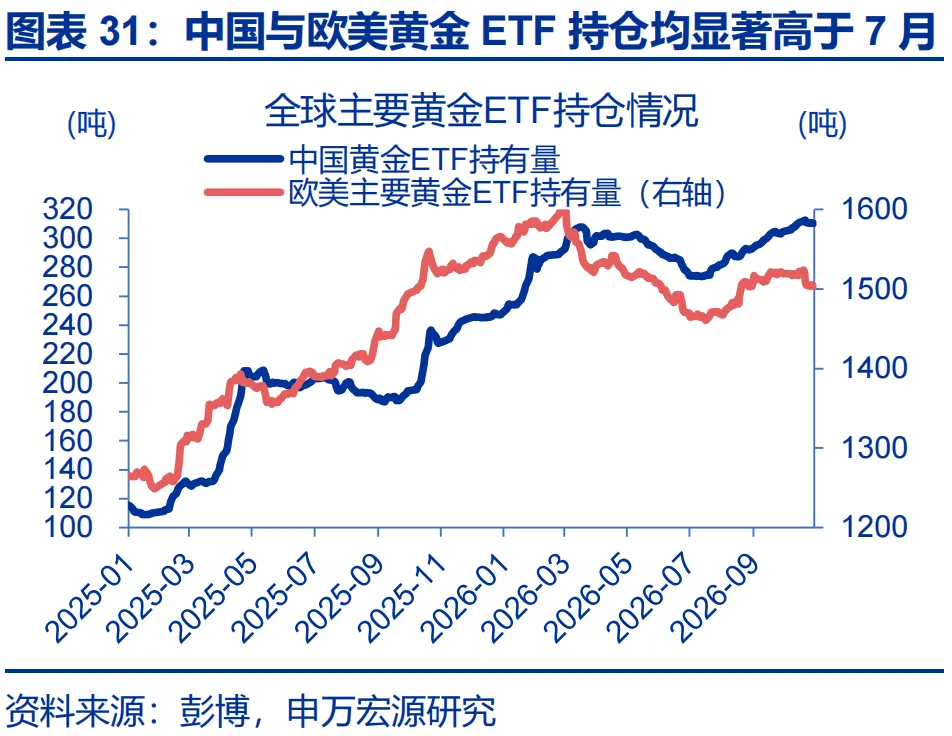
Currently, from the perspectives of sentiment and trading dynamics, the environment for gold resembles that of July this year, although supporting forces may be relatively weaker than at that time. 1) The current RSI has again fallen below 30, the 3-month implied volatility has hit a new low for the year, and the historical percentile of net long non-commercial positions is approaching the lows seen in July. 2) However, holdings in Chinese gold ETFs have increased by 13.4% compared to July 13, while European and American ETF holdings have also risen by 2.5%.
Risk Warning
Tightening of U.S. financial conditions; escalation of geopolitical conflicts; the Federal Reserve turning more "hawkish" than expected
Report Body
Since October, gold has continued to weaken rapidly despite no significant reduction in ETF holdings, a sharp decline in U.S. Treasury yields, and fluctuations in the U.S. dollar, which clearly contradicts traditional patterns. What are the drivers behind this "anomalous" weakness in gold prices, and how might the situation evolve?
I. Key Considerations: Is Gold No Longer a Safe Haven?
(1) What are the "anomalies" in the recent decline of gold? U.S. Treasury yields have fallen, and gold ETF holdings have increased, yet gold prices have still plummeted.
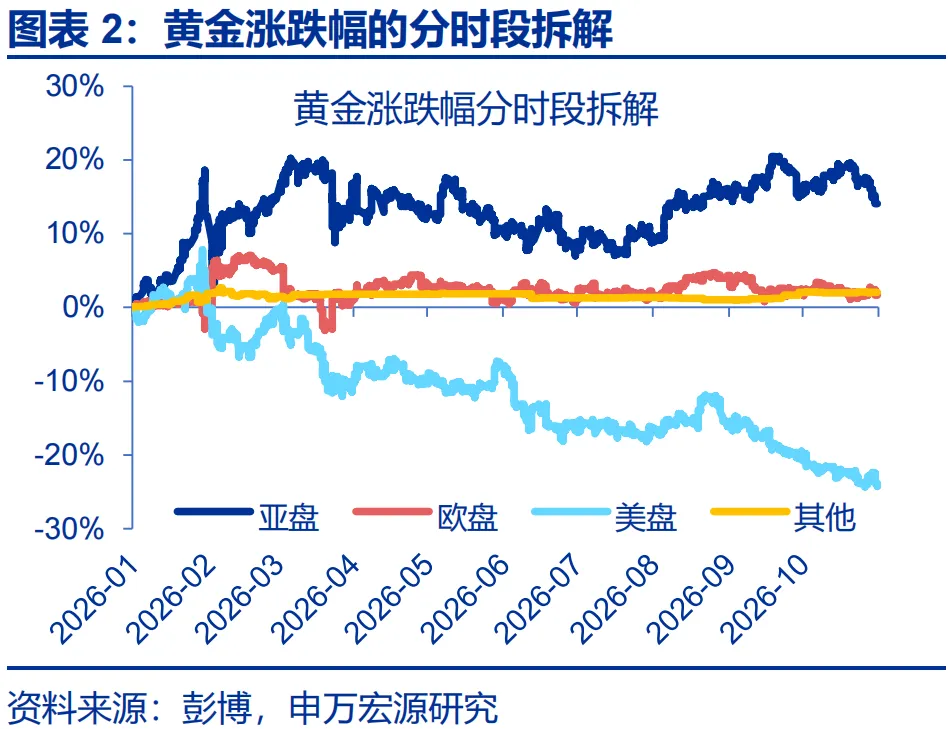
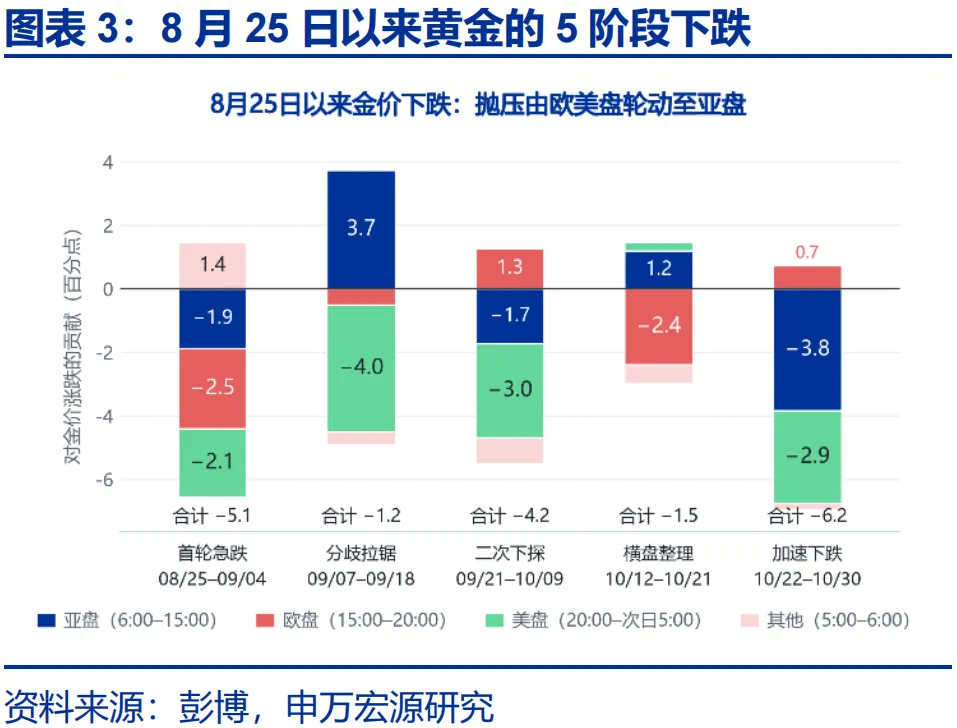
Since August 25, gold prices have fallen rapidly, dropping below $1,650 per ounce on October 30 to hit a new low for the year. This round of declines can be broadly divided into three stages: 1) From August 25 to September 29, gold continued to fall against the backdrop of the Federal Reserve's hawkish pivot and renewed escalation of geopolitical risks, with significantly deeper declines during European and U.S. trading hours; 2) From September 30 to October 21, gold traded sideways; 3) Since October 22, Asian and U.S. sessions have weakened in tandem, leading to an accelerated decline in gold, which dropped rapidly by 6.2%.
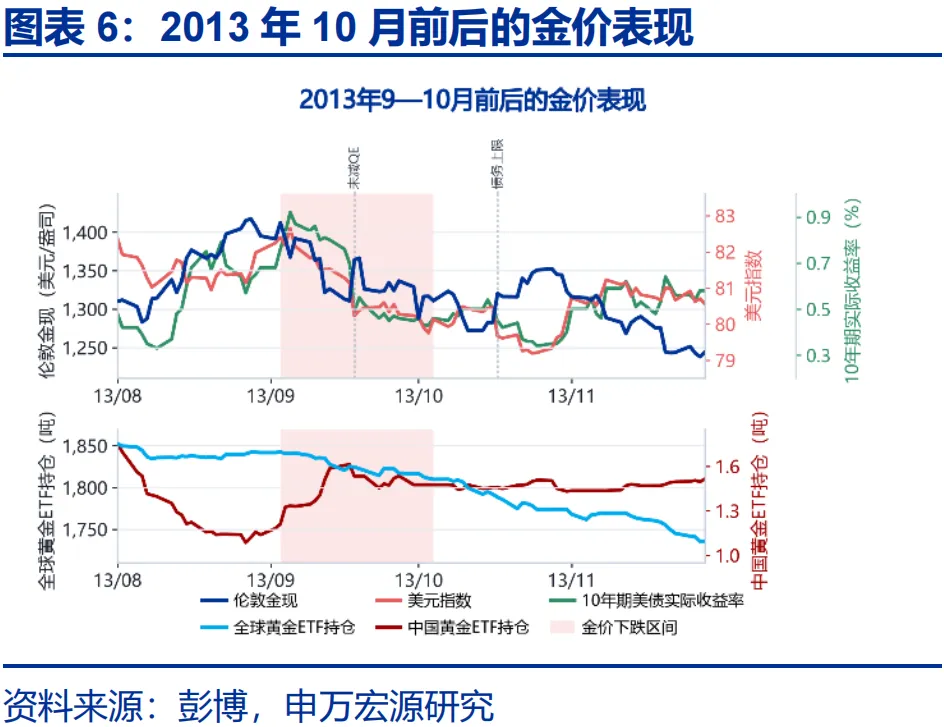
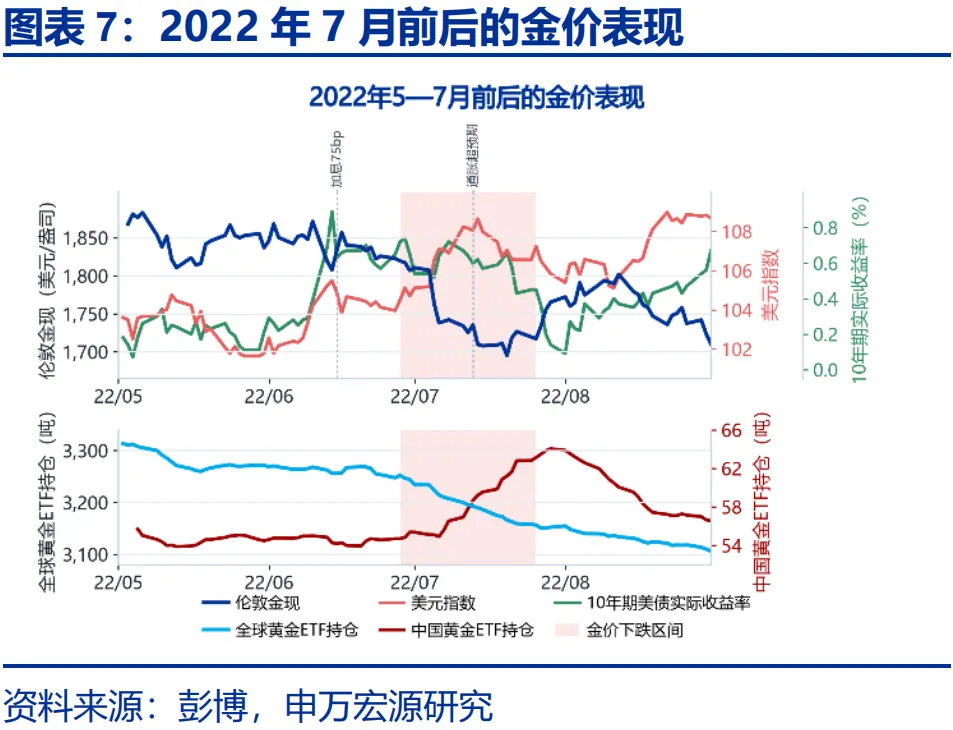
There are two major "anomalies" in this sharp decline in gold: First, the substantial drop in gold prices since October occurred against the backdrop of a rapid decline in the 10-year U.S. Treasury real yield. Historical backtesting shows that only in October 2013 and July 2022 did gold fall by more than 5% while the 10-year U.S. Treasury real yield dropped by more than 25 basis points. 1) In October 2013, the 10-year U.S. Treasury real yield fell by 41 basis points and the U.S. dollar dropped by 2.5%, both of which were bullish for gold; however, the core market narrative at the time was the "buy the rumor, sell the news" reaction to the September QE not being tapered, which triggered rapid ETF redemptions and a subsequent fall in gold prices. 2) In July 2022, recession fears initially led to a decline in U.S. Treasury yields, but the U.S. dollar strengthened significantly by nearly 3% due to weaker expectations for Europe, offsetting the bullish impact of falling U.S. Treasury real yields.
Second, global gold ETFs did not reduce their holdings, yet gold prices experienced a sharp decline. Historically, only in March 2015 and May 2022 did gold fall by more than 8% while gold ETFs were simultaneously increasing their holdings. 1) The primary driver of the sharp drop in gold prices in Q1 2015 was the US dollar; for instance, following the implementation of the ECB's QE program, the US Dollar Index surged 5.9% in two months, breaking above 100 for the first time since 2003. The strong dollar exerted passive downward pressure on gold. 2) From March to May 2022, gold prices fell 8.9%. Although global ETFs continued to buy gold driven by safe-haven demand amid the Russia-Ukraine conflict, the subsequent hawkish pivot by the Federal Reserve, combined with a significant rise in real US Treasury yields and a marked strengthening of the US dollar, created dual headwinds for gold.
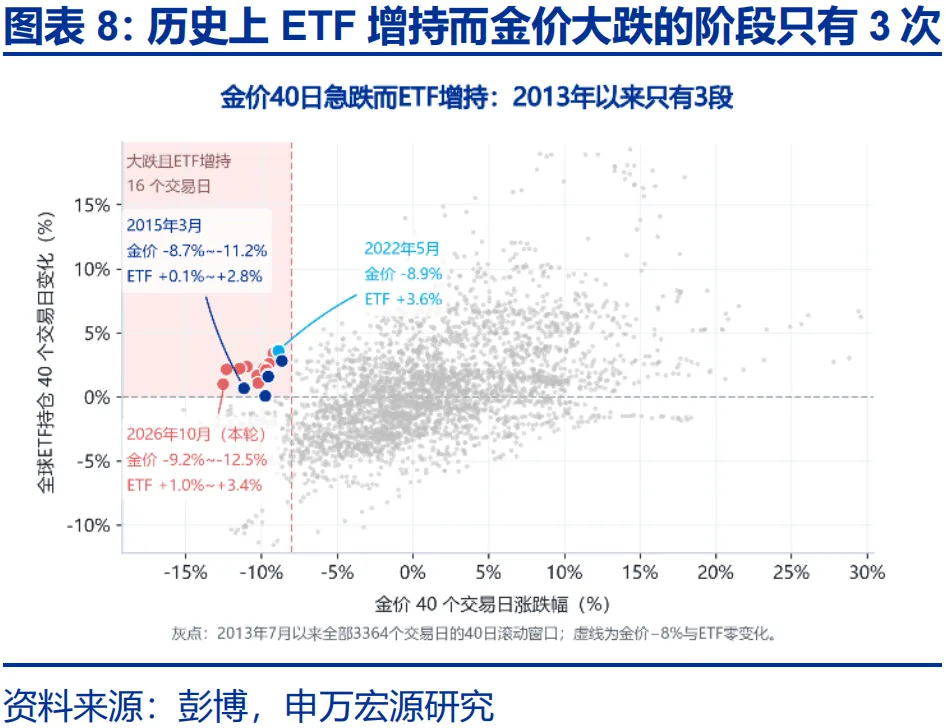
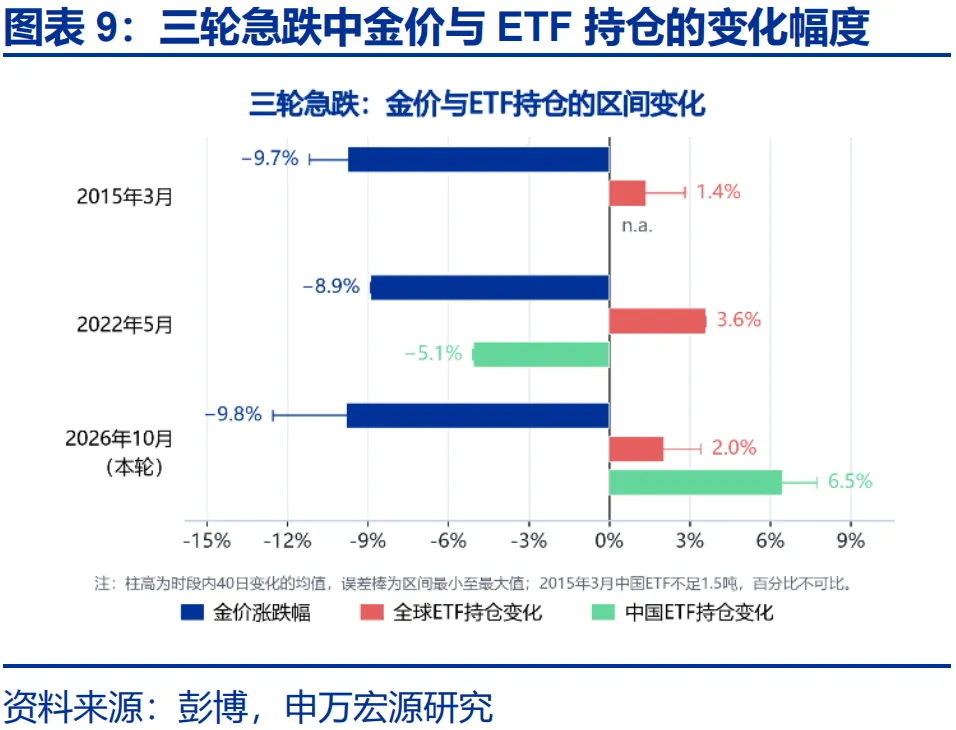
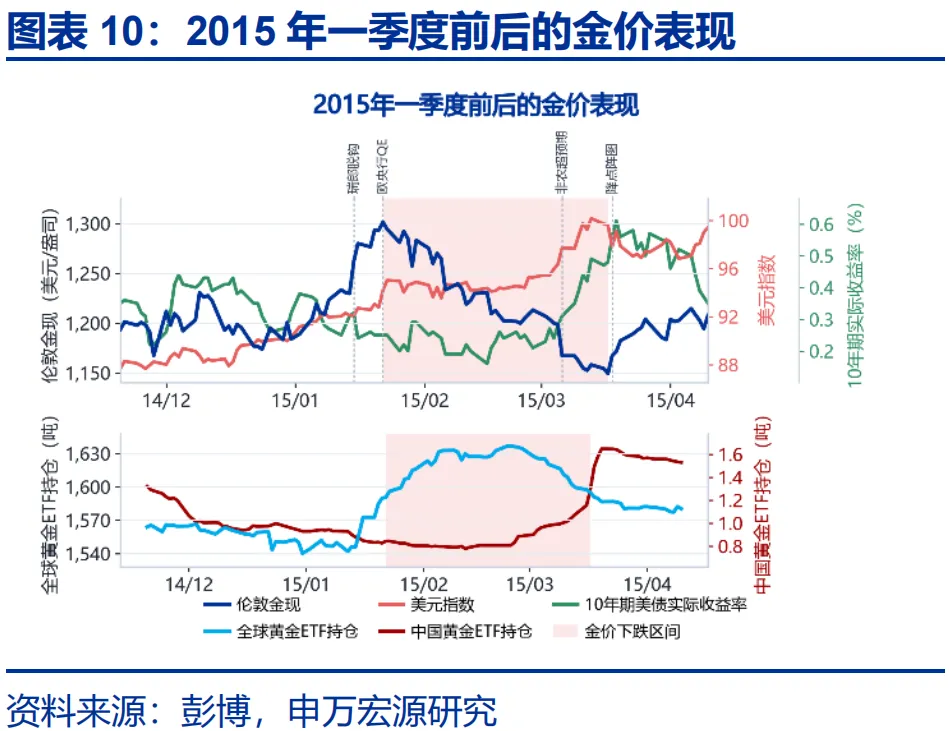
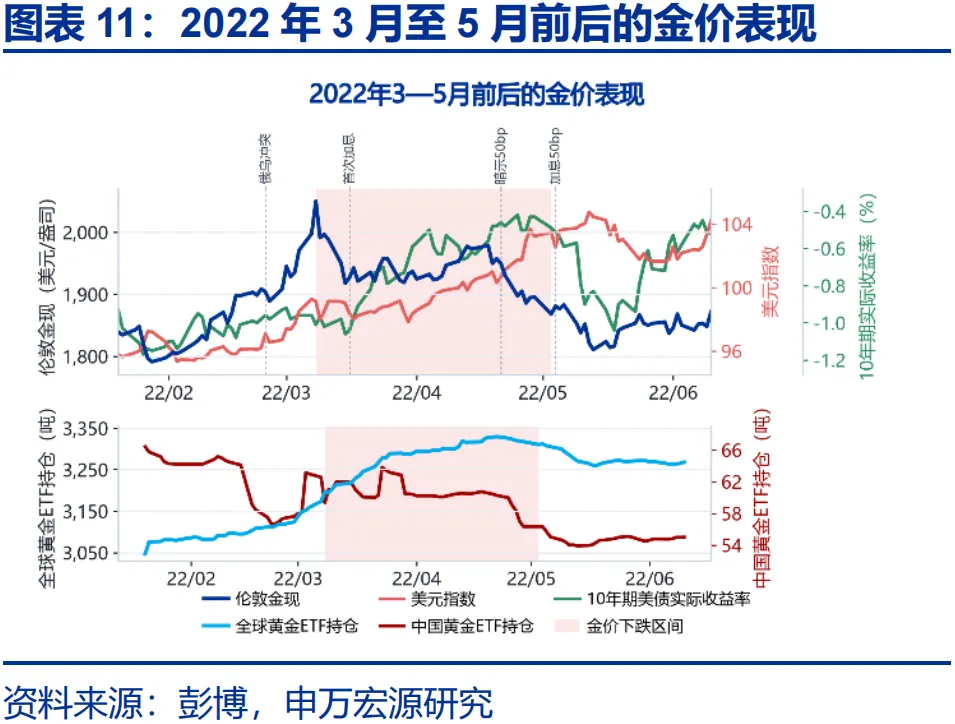
In summary, historically, the simultaneous occurrence of a sharp drop in gold prices, a decline in US Treasury yields, and an increase in gold ETF holdings has only happened in the current cycle. During this period, the US dollar remained range-bound and did not exert significant downward pressure on gold prices.
(II) What are the potential drivers behind the "anomalous" weakness? The "spillover effect" of the sharp equity market decline and expectations of a "revitalization" of US dollar credibility
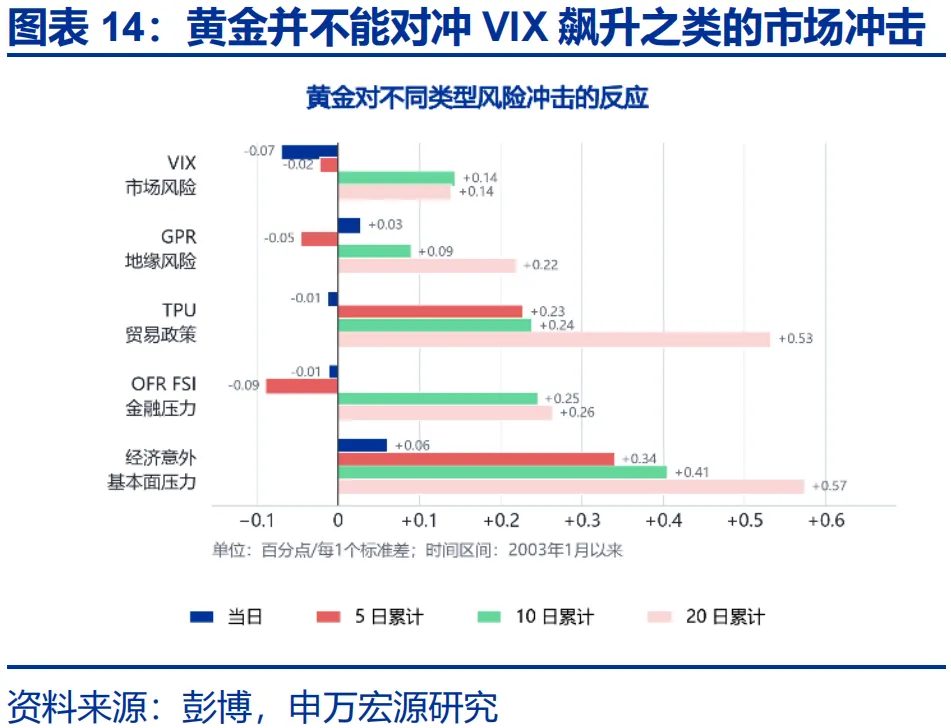
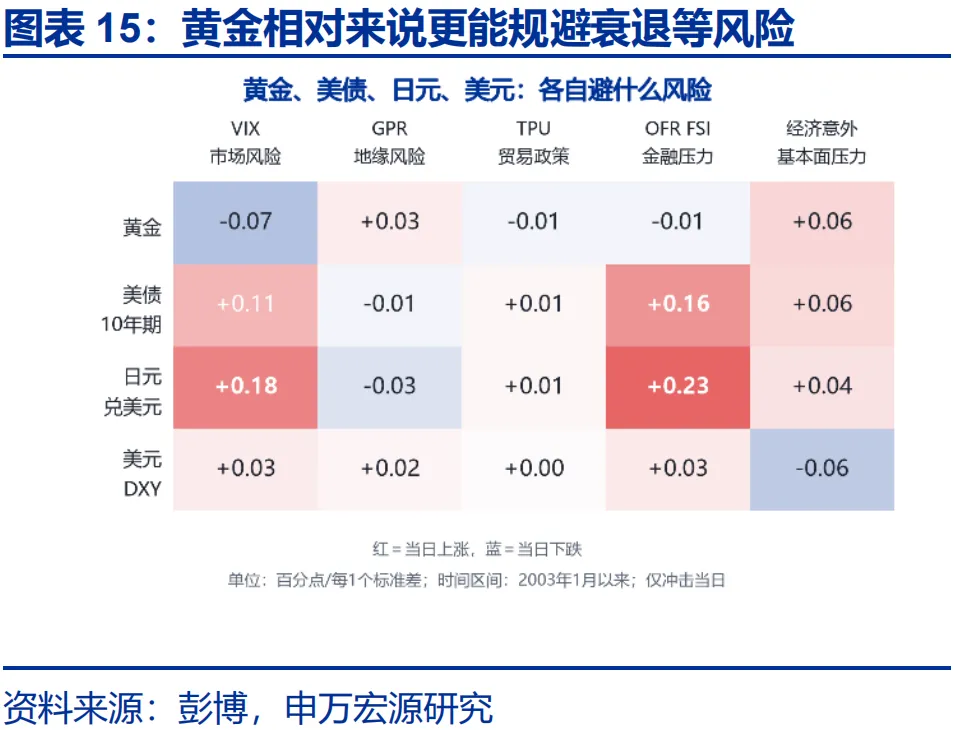
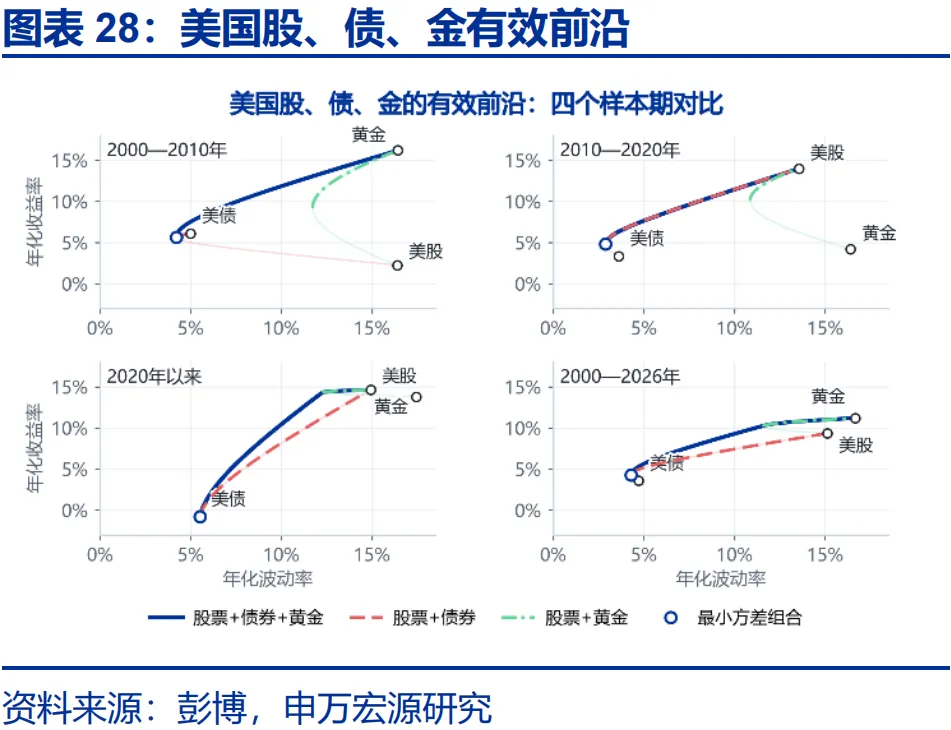
First, the "spillover effect" from the sharp decline in equity markets may be a key driver of gold's weakness since late October. This is primarily reflected in dimensions of "volatility spillover" and sentiment shock. Since April 2026, the correlation between gold and US equities has remained at high levels, exceeding that with US Treasuries, the US dollar, and Brent crude oil. Year-to-date, the Nasdaq Composite has experienced 11 single-day drops of more than 2%, and in 8 of these instances, gold prices also fell by more than 1.7% on the same day. This appears to conflict with the traditional view of gold as a "safe-haven asset." However, in reality, gold prices often fall during periods of surging VIX; assets such as US Treasuries serve as the true hedges against equity market risk. The recent concurrent decline in stocks and gold, alongside a sharp rally in US Treasuries, may precisely reflect the result of "equity market volatility spilling over into gold due to high correlation, prompting investors to shift from assets like stocks and gold to US Treasuries for safe-haven purposes."
Secondly, the "liquidity shock" transmitted through equity assets may have also contributed to the decline in gold prices. Since 2025, the proportion of margin trading in the US stock market has continued to rise. In the context where sharp declines in equity markets subjected some institutions to liquidity shocks, investors may have sought liquidity by pledging gold for leases or selling directly. This behavior leads to a significant drop in gold lease rates, accompanied by a marginal tightening of money market liquidity. Since October 22, the 3-month gold lease rate has rapidly declined by 45 basis points, while the spread between SOFR and IORB has increased by 4 basis points.
Second, economic resilience, the reshaping of Federal Reserve independence, and the increasingly heated expectations of "US fiscal consolidation" may have revitalized confidence in the US dollar to some extent, exerting pressure on gold. Since August, Governor Waller's statements and rate hike measures may have helped defend the "Fed independence" that the market had previously begun to doubt. The resilience of the US economy has also alleviated market concerns about the US dollar to some degree. Furthermore, since September, as attention toward the midterm elections intensified and expectations rose for a Democratic victory in the Senate, some investors began focusing on the potential "fiscal consolidation" that might follow a Democratic sweep of both chambers. Since September, the probability of Democrats winning the Senate has shown a negative correlation of 0.81 with gold and a positive correlation of 0.88 with the US dollar, which may partially corroborate the narrative of "US dollar credibility."
(III) Looking ahead, when will gold "stabilize"? Short-term downward pressures may ease marginally, but medium-term stabilization may still await the clearing of risks such as accelerated rate hikes
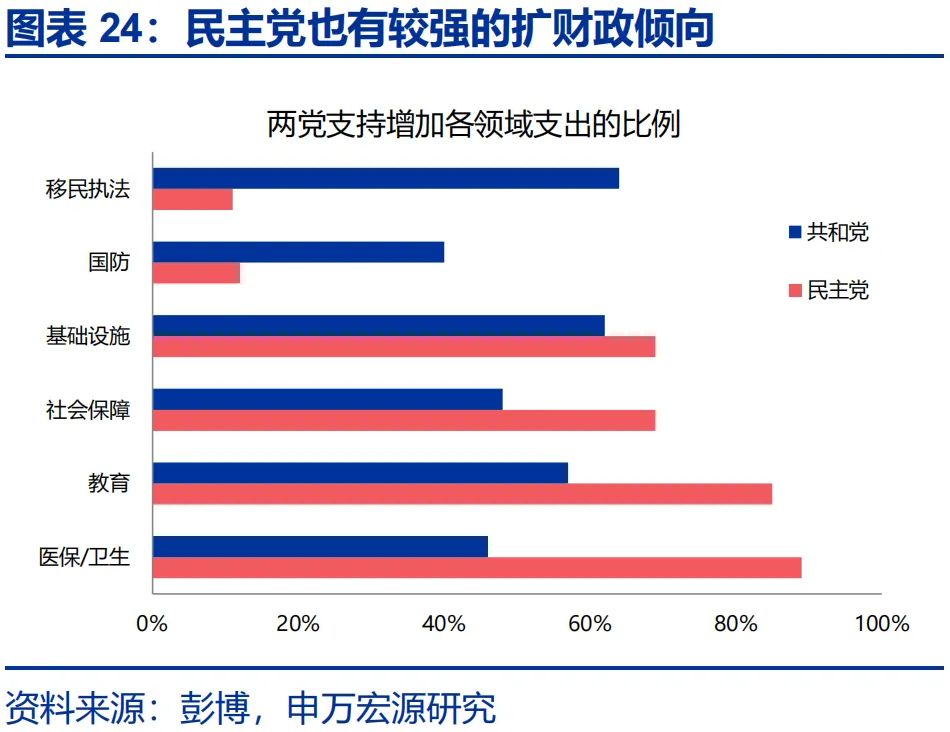
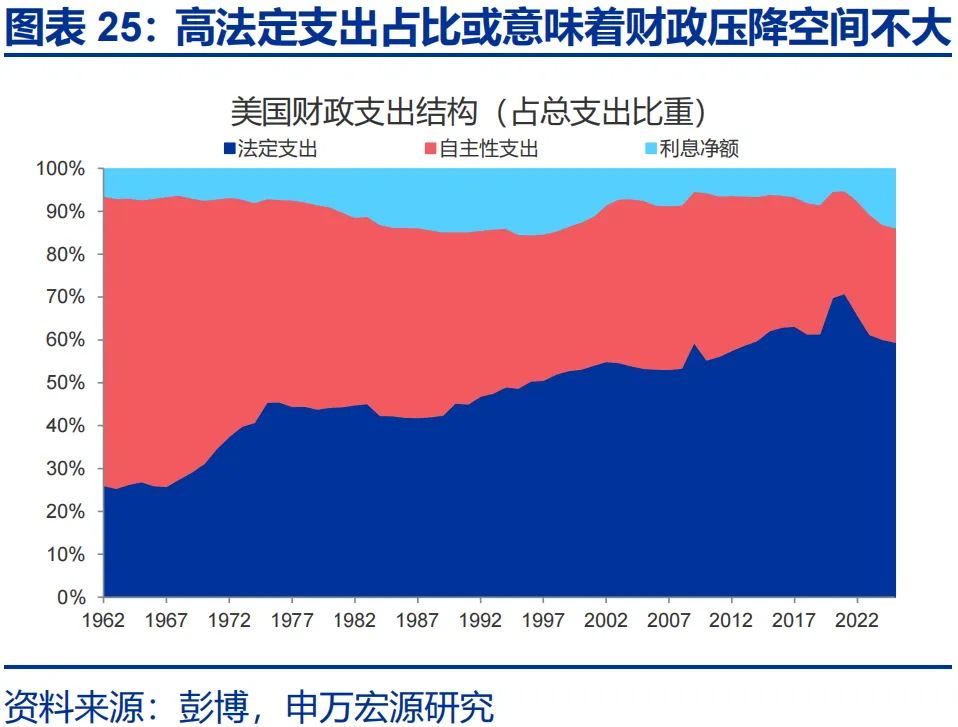
In the short term, as the midterm elections, Q3 earnings reports for US stocks, and the Q4 treasury refinancing meeting unfold sequentially, factors that previously pressured gold may see marginal relief. First, current polls tend to overestimate the Democratic Party's chances of winning; even if Democrats secure both chambers, their inclination toward expansionary fiscal policy and the difficulty in reducing mandatory spending and interest expenses remain significant obstacles to implementing "fiscal consolidation." Second, as the midterm elections conclude, market volatility tends to subside. Coupled with the end of the Q3 earnings season, the "spillover effect" of US stock declines on gold may weaken marginally. Third, the Q4 treasury refinancing meeting could reignite market concerns regarding the supply of long-end US Treasuries and the sustainability of US fiscal policy.
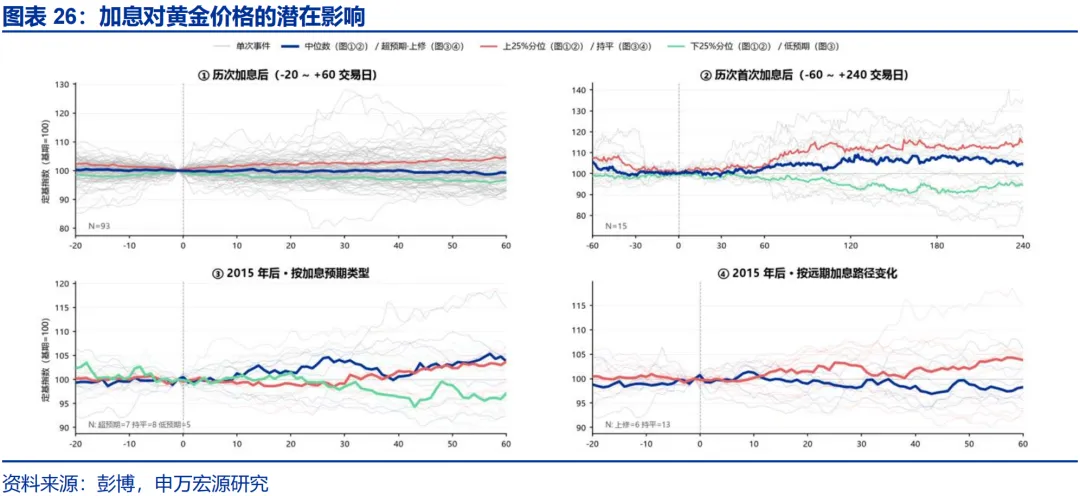
However, in the medium term, uncertainties surrounding the rate hike path and potential risks arising from the high positive correlation between equities and gold persist. 1) Compared to a single rate hike itself, whether rate hikes exceed expectations and whether the rate hike path continues to be revised upward have a stronger medium-term impact on gold prices. Historically, rate hikes with low prior expectations can trigger market fears of larger subsequent hikes, which is actually more unfavorable for gold prices. Continuous upward revisions of the forward rate hike path are also more likely to cause sustained shocks to gold prices. Currently, given sticky inflation and economic resilience, the risk of multiple medium-term rate hikes may exert downward pressure on gold. 2) Currently, the one-year rolling correlation between equities and gold has reached a nearly 10-year high. On one hand, high correlation may make equity volatility more prone to spilling over into the gold market; on the other hand, high correlation may undermine gold's hedging value within portfolios, leading to a marginal weakening of allocation demand.
Currently, from the perspectives of sentiment and trading dynamics, the environment for gold is similar to that of July this year, but supporting forces may be relatively weaker than at that time. 1) In terms of sentiment indicators, the RSI has again fallen below 30, the 3-month implied volatility has hit a new low for the year, and the historical percentile of net long positions held by non-commercial traders is approaching the lows seen in July, indicating that current market sentiment is relatively pessimistic. 2) However, looking at gold ETF holdings, Chinese gold ETF holdings have increased by 13.4% compared to July 13, and European and American ETF holdings have also risen by 2.5%. Additionally, gold prices during Asian trading hours have outperformed July levels by approximately 7%. This may imply that the supporting forces for gold in this cycle are slightly weaker than they were in July.
Risk Warning
1. U.S. financial conditions tighten more than expected. If volatility in U.S. interest rates, exchange rates, and asset prices increases, households and corporations may face certain adjustment pressures.
2. Escalation of geopolitical conflicts. The U.S.-Iran conflict has not yet ended; geopolitical tensions could exacerbate crude oil price volatility, disrupting the global "disinflation" process and expectations for a "soft landing."
3. The Federal Reserve turns more "hawkish" than expected. If U.S. inflation demonstrates greater resilience, it could affect the pace of future rate cuts by the Fed.
Edited by Melody