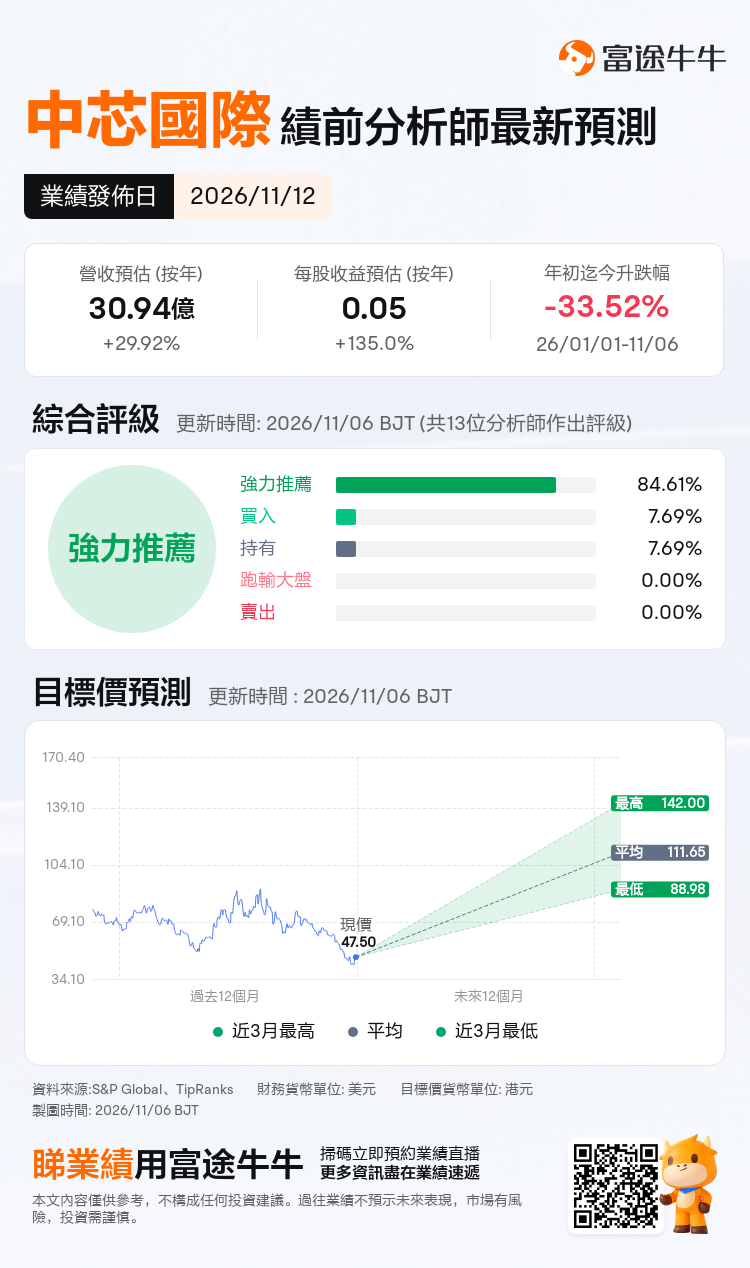
November 12 $SMIC (00981.HK)$ The company will disclose its third-quarter 2026 results after the Hong Kong stock market closes on Thursday and hold an earnings briefing at 8:30 a.m. on November 13. According to previous guidance, Q3 revenue is expected to increase by 2% to 4% quarter-over-quarter, corresponding to approximately USD 3.066 billion to USD 3.126 billion; gross margin is projected at 26% to 28%, a further improvement from 25.3% in Q2.
Consensus estimates for 2026 Q3 anticipate revenue of USD 3.094 billion, a year-over-year increase of 29.92%; expected earnings per share (EPS) are USD 0.05, representing a 135.0% year-over-year increase.
In the second quarter, SMIC’s quarterly revenue exceeded USD 3 billion for the first time, driven by improvements in wafer sales volume, average selling price (ASP), and product mix. Entering the third quarter, key verification points in the financial report include whether the additional gross profit generated by price increases and AI-related peripheral demand can cover expansion costs and sustain into the fourth quarter.
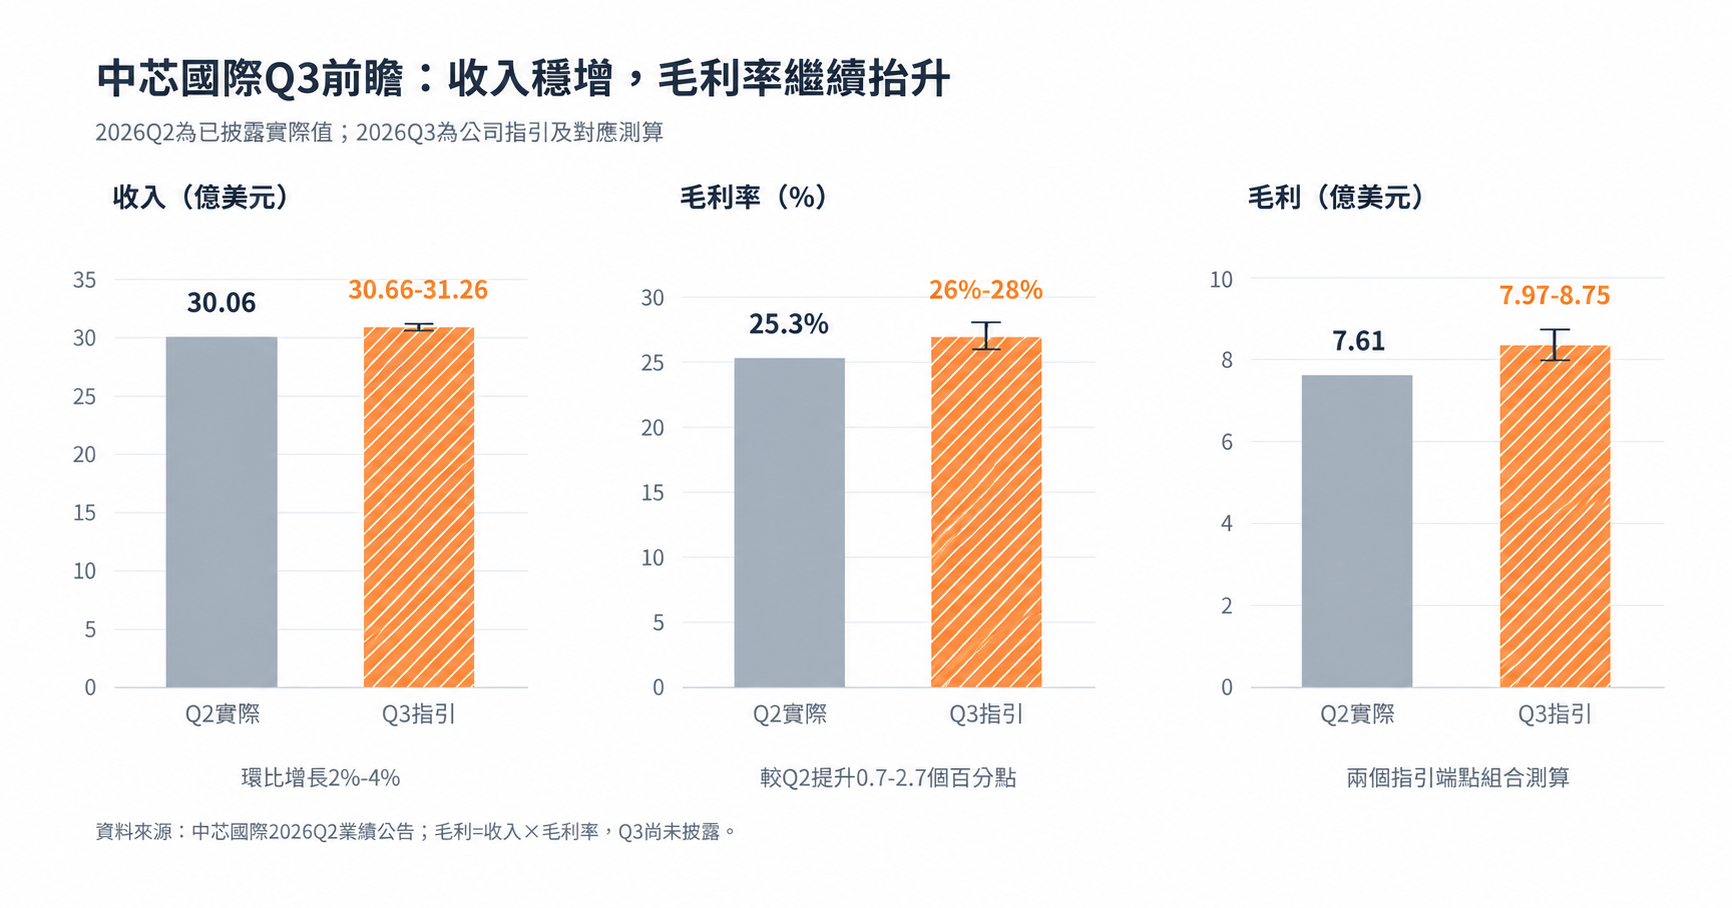
Key Focus 1: Continued realization of price increase effects; whether gross margin can reach approximately 28%
 Q2 revenue grew by 20.0% quarter-over-quarter, with gross margin improving by 5.2 percentage points. The company attributed this growth to increased wafer shipment volumes, higher average selling prices, and changes in product mix. In contrast, the Q3 revenue guidance of a 2% to 4% quarter-over-quarter increase indicates a significant slowdown, although gross margin is still expected to continue rising.
This implies that the focus in Q3 is shifting further from shipment expansion to the profit contribution per wafer. Based on the midpoints of the revenue and gross margin guidance, Q3 gross profit is estimated at approximately USD 836 million, an increase of about 9.9% from Q2; if both metrics hit the upper end of the guidance range, gross profit would be approximately USD 875 million, representing a quarter-over-quarter increase of about 15.1%.
Therefore, whether gross margin approaches 28%, and whether the improvement stems from price hikes for similar products, an increased proportion of high-value products, or yield improvements, will directly influence market judgments on the sustainability of profit recovery. Achieving a margin within the 26% to 28% range fulfills existing guidance; exceeding the upper bound with sustainable operational support would be more conducive to further upward revisions in expectations.
Additionally, management’s outlook on Q4 orders, pricing, and capacity is more likely to alter expectations post-earnings. Positive signals to watch include continued quarter-over-quarter revenue growth, maintenance of improved gross margin levels, confirmation of price increases through repeat orders, and customer demand supporting new capacity additions.
Caution is warranted regarding potential slowing revenue growth and declining utilization rates as advance inventory stocking subsides, while depreciation and capital expenditures remain high. If full-year 2026 revenue reaches USD 12 billion, based on actual H1 revenue and the midpoint of Q3 guidance, Q4 revenue would need to be approximately USD 3.393 billion, representing a quarter-over-quarter increase of about 9.6%.
Key Point 2: Gross margin improvement; net profit attributable to shareholders requires detailed analysis following the consolidation of SMIC Beijing.
In Q2, SMIC's net profit attributable to shareholders reached USD 479 million, a quarter-on-quarter increase of 142.7%, significantly outpacing revenue growth. However, besides improvements in manufacturing operations, the quarter's profit also included contributions from gains in associates and joint ventures, as well as changes in the valuation of financial assets.
Specifically, the share of profits and losses from associates and joint ventures amounted to approximately USD 194 million, while other net gains totaled around USD 64 million. The company noted that these changes were primarily driven by fair value adjustments in certain investment portfolios and equity investments. Such gains are volatile and cannot be directly extrapolated to Q3.
Therefore, for Q3, it is essential to understand the following dynamic: while revenue, gross margin, and operating profit may continue to improve, net profit attributable to shareholders could still decline quarter-on-quarter if contributions from investment income decrease. Assessing the quality of financial results requires a simultaneous comparison of changes in operating profit, non-recurring item-adjusted performance, and investment income, rather than drawing conclusions solely based on the directional change in net profit attributable to shareholders.
Another variable is SMIC Beijing. The company acquired the remaining 49% equity interest in June, meaning Q3 will reflect a full quarter of changes in profit attribution. Meanwhile, shares issued for this transaction will be fully included in the quarterly weighted average number of shares. As SMIC Beijing was already consolidated in previous periods, this transaction will directly impact net profit attributable to shareholders and earnings per share (EPS).
Key Point 3: Sustainability of AI-related peripheral demand; the rising proportion of industrial and automotive sectors warrants close monitoring.
AI's drive for SMIC includes not only demand for peripheral chips such as power management, data transmission, and drivers, but also order opportunities arising from shifts in global capacity allocation.
In its September industry research, TrendForce pointed out that orders for AI peripheral chips and server network-related products supported SMIC's growth in the second quarter. Additionally, there was advance purchasing within consumer supply chains, including PCs and laptops.
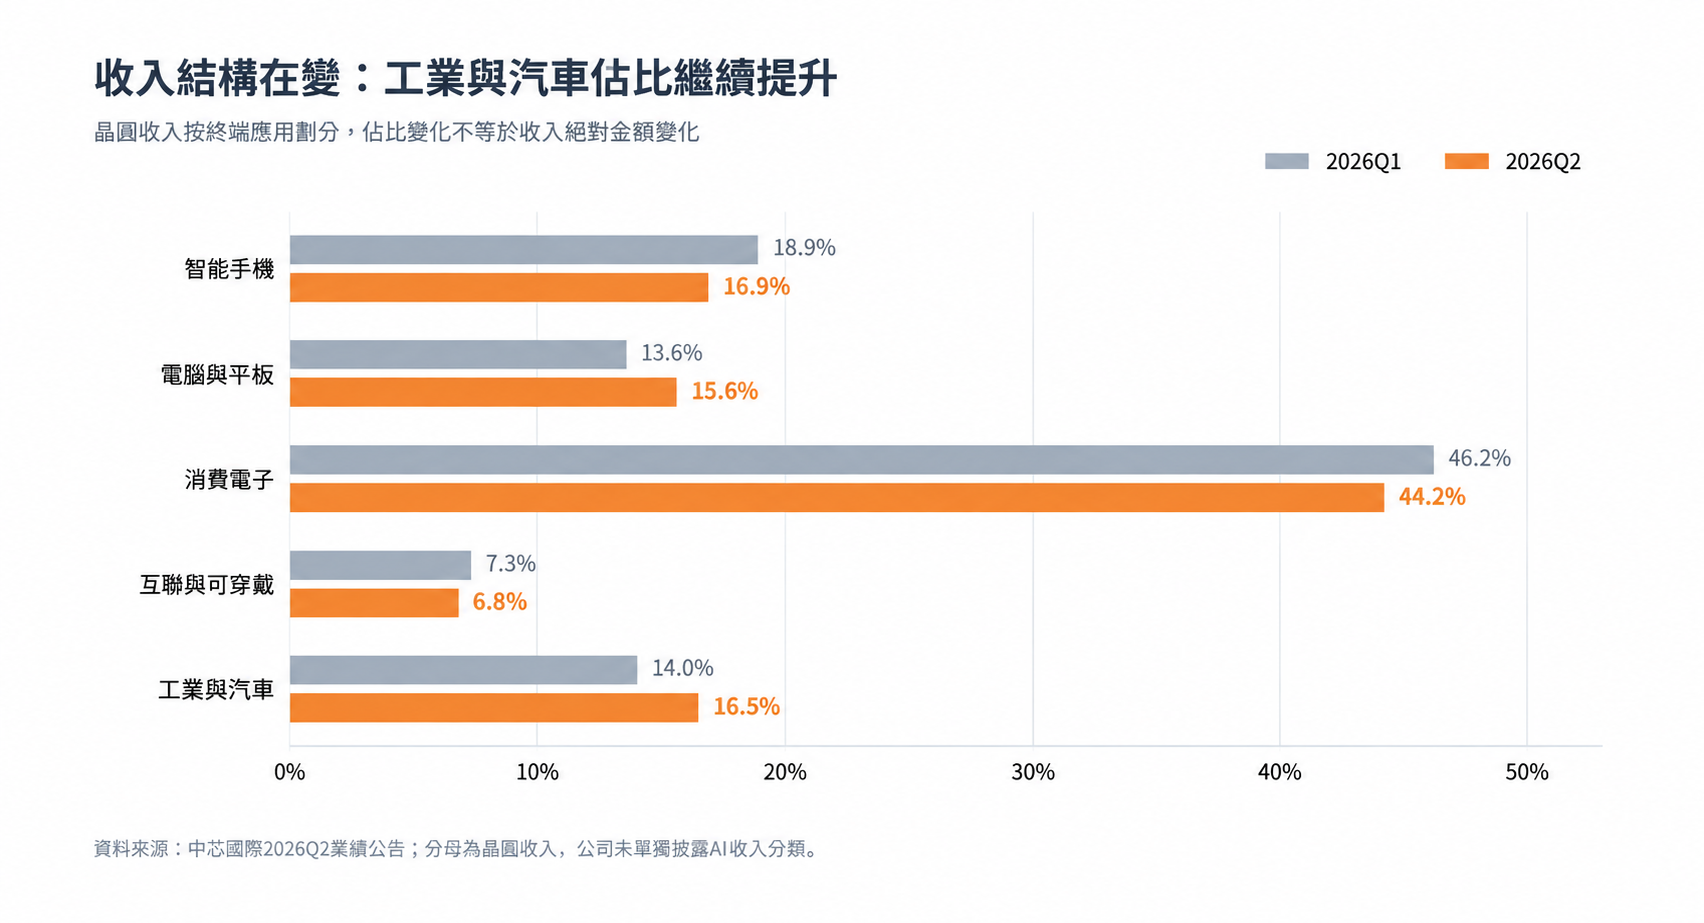
Changes in revenue structure have already emerged. In Q2, the proportion of industrial and automotive segments in wafer revenue rose from 14.0% in Q1 to 16.5%, computers and tablets increased from 13.6% to 15.6%, while smartphones declined from 18.9% to 16.9%.
In Q3, it is worth observing the absolute revenue amounts and order sustainability in these sectors. If demand for industrial, automotive, and server-related components continues to ramp up, it will help broaden growth sources. However, if growth relies mainly on customers stocking up early due to concerns about shortages and price hikes, caution is needed regarding potential volatility resulting from the front-loading of demand.
Key Point 4: Can new capacity outpace depreciation under high utilization rates?
In Q2, the company’s monthly production capacity rose to 1.0965 million 8-inch wafer equivalents, with a capacity utilization rate of 93.7%. Quarterly shipments increased by 14.4% quarter-over-quarter. Existing production lines are already operating at high utilization levels, so future growth will depend more heavily on the certification of new capacity, customer onboarding, and effective output.
The flip side of capacity expansion is depreciation. Total depreciation and amortization in Q2 amounted to approximately USD 1.212 billion, a year-on-year increase of 37.9%; of this, depreciation and amortization included in cost of sales was approximately USD 925 million. Due to differences in accounting scope, not all depreciation should be directly deducted again from gross profit.
In Q3, it is essential to analyze the release of new capacity, unit manufacturing costs, and the growth rate of depreciation together. If new capacity contributes to revenue while selling prices and yield rates improve simultaneously, fixed costs may continue to be absorbed. However, if depreciation from new lines hits the financial statements before orders and yields ramp up significantly, profit realization may lag behind revenue growth.
Cash flow serves as another validation metric. Based on actual equipment payments in the first half of the year, operating cash flow minus cash expenditures on equipment has turned slightly positive. However, the timing of equipment payments does not always align with the progress of capital investment, so continued observation of cash collection in Q3 and subsequent payment pressures is necessary.
For this earnings report, focus should be placed on three verification lines: whether the gross margin can approach the upper end of guidance, whether profitability continues to improve after excluding fluctuations in investment valuations, and whether Q4 demand and pricing can sustain growth. Price hikes and AI spillover effects have provided clues to operational improvement; what is needed next is further evidence in terms of earnings per share and cash recovery.
Fellow investors, do you think the biggest expectation gap in this earnings report will stem from gross margin performance or Q4 guidance?
 AI-powered Earnings Express highlights key points; build your options strategy in three steps! Open Futubull > Stock Page > Click [Company] >Earnings Flash

Edited by Rocky