
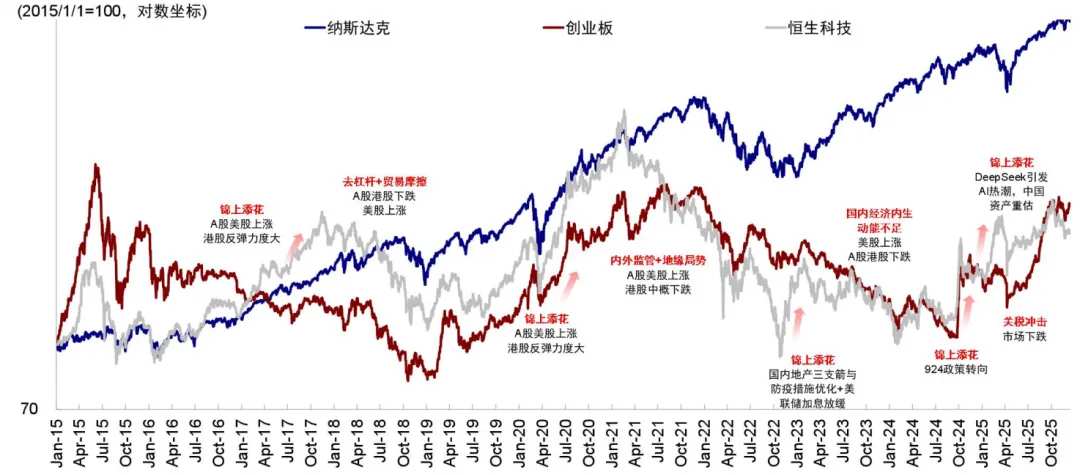
Since the beginning of 2025, the markets of the US, China A-shares, and Hong Kong have exhibited a quarterly switching pattern, showing both a seesaw effect of one rising as the other falls and cross-market mapping linkages. In the first quarter, DeepSeek led the revaluation of Chinese assets, with Hang Seng Tech taking the lead; in the second quarter, after the US imposed reciprocal tariffs, US stocks outperformed due to better-than-expected results and capital expenditure increases by AI leaders, while new consumption and innovative drugs in Hong Kong started to gain traction, though Hang Seng Tech never returned to its March high; in the third quarter, the narrative of domestic capital entering the market strengthened, and the computing power rally in Sci-Tech Innovation pushed A-shares to surpass later on; in September, the 'loose trading' narrative and the AI story of leading Chinese Internet companies once again made Hong Kong stocks outperform.
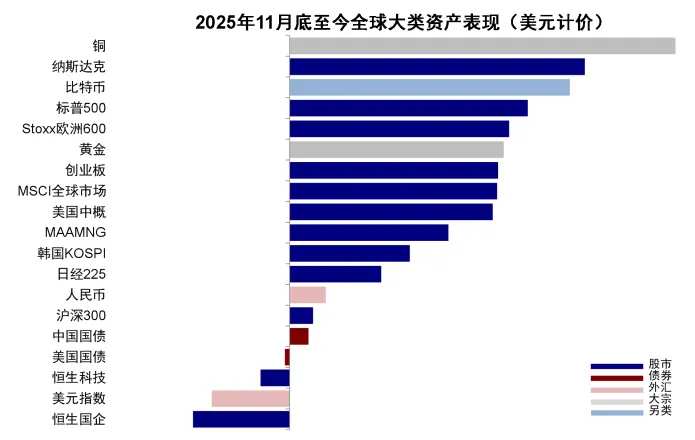
However, since late November, Hong Kong-listed Chinese stocks in the three major markets have been particularly weak, with not only larger declines but also failing to keep pace with the recovery momentum of U.S. and mainland Chinese equities. The Hang Seng China Enterprises Index fell by 2.2%, while the Hang Seng Tech Index dropped by 0.7%. In contrast, both mainland China and U.S. equities posted positive returns, with the CSI 300 up 0.5%, and the S&P 500 and Nasdaq rising by 5.5% and 6.9%, respectively; Hong Kong stocks only rebounded last Friday. Why has Hong Kong's market performed weaker relative to the other two markets recently? Looking ahead, how should one choose among the U.S., mainland China, and Hong Kong markets?
Chart 1: Quarterly market switching patterns among the US, Hong Kong, and A-shares
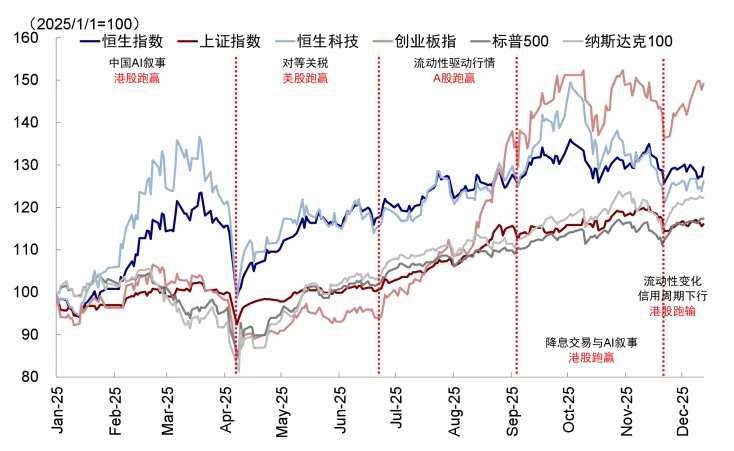
 Chart 2: Since the end of November, Hong Kong stocks have underperformed major global markets
Why has Hong Kong's market performed weaker relative to the other two markets recently? The market is more sensitive to liquidity, while its structure is more sensitive to fundamentals.
Hong Kong stocks have performed weaker among the three recently, directly related to their sensitivity to liquidity changes and structural differences. As an offshore market, Hong Kong stocks are more sensitive to liquidity changes, with recent funding conditions being weak and experiencing numerous fluctuations.
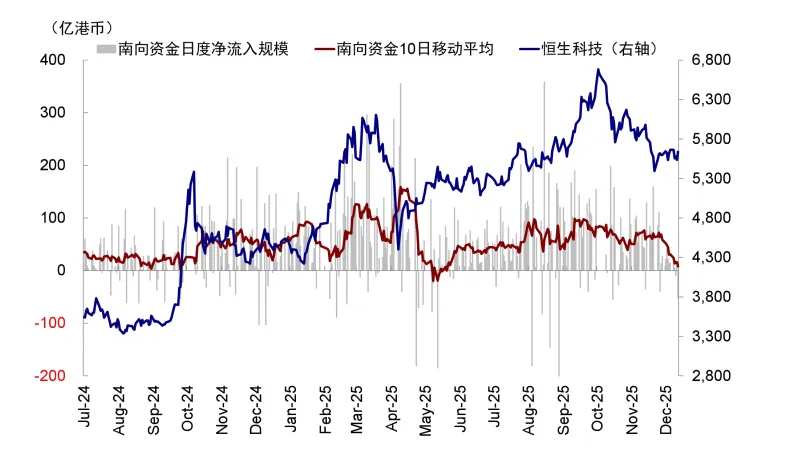
Firstly, inflows from Southbound trading have slowed, with investors speculating that this may be partly related to new regulations on funds. Since late November, net inflows of Southbound capital have continued to shrink, with the 10-day moving average dropping from a previous daily average of HKD 7 billion to less than HKD 1 billion, and even turning into net outflows last week.
On December 6, regulators issued the 'Guidance on Performance Evaluation Management for Fund Management Companies (Draft for Comments),' requiring fund companies to establish a performance evaluation system centered on investment returns and strengthen benchmark constraints. As of Q3, actively managed mainland equity funds were overweight in Hong Kong stocks by approximately RMB 198 billion, with Hong Kong stock holdings accounting for 30.8% of their total equity holdings, but the proportion of Hong Kong stocks in their benchmarks was only 17%, indicating significant overallocation. Hence, the market is concerned that rebalancing could lead to capital outflows.
We do not rule out the possibility of short-term impacts from this factor, but it should not be extrapolated indefinitely because: 1) It is directly related to investors' expectations of future market strength or weakness; 2) The proportion of actively managed public mutual funds in Southbound flows has been decreasing. As of Q3, such funds held RMB 522.8 billion worth of Hong Kong stocks, accounting for only 9.1% of Southbound capital, compared to insurance, individual, and trading-oriented funds which are not dominant. In terms of incremental capital, we estimate that actively managed mutual funds will contribute a net increase of approximately HKD 80-10 billion in Hong Kong stocks in 2025, accounting for only about 10-12% of Southbound capital since the beginning of the year.
Chart 3: Southbound net inflows have shrunk since the end of November.
Secondly, Hong Kong stocks have lacked support in terms of external liquidity, with active foreign capital outflows and U.S. Treasury yields rising after the Fed’s hawkish rate cut. In addition to EPFR data showing recent weakness in foreign capital (active foreign capital cumulatively flowed out of Hong Kong stocks and ADRs by USD 460 million over the past three weeks, while flowing into mainland China stocks by USD 20 million during the same period; passive foreign capital inflows slowed from USD 4.87 billion over the previous three weeks to USD 3.15 billion over the recent three weeks), concerns over the Bank of Japan’s interest rate hike lingered, and the Fed’s hawkish rate cut in December caused the 10-year U.S. Treasury yield to rise instead of fall, leaving Hong Kong stocks without external liquidity support.
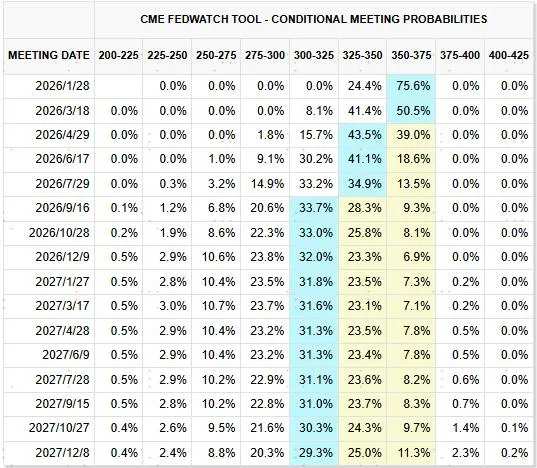
Although the Fed cut rates by 25 basis points as expected at the December FOMC meeting, the updated 'dot plot' and revised statement both hinted at a 'hawkish' signal that rate cuts might pause. Balance sheet expansion primarily affected short-term bond yields and liquidity in the U.S. repo market, causing long-term U.S. Treasury yields to rise instead of fall. We have consistently cautioned against a common 'misconception' in the market: rate cuts should not be equated with declines in U.S. Treasury yields or a weaker dollar, especially in the case of hawkish rate cuts. The trend since September’s rate cut has continuously validated this point ('New Changes in Liquidity' and 'What Matters More Than the December Rate Cut').
Chart 4: CME interest rate futures predict two rate cuts by 2026.
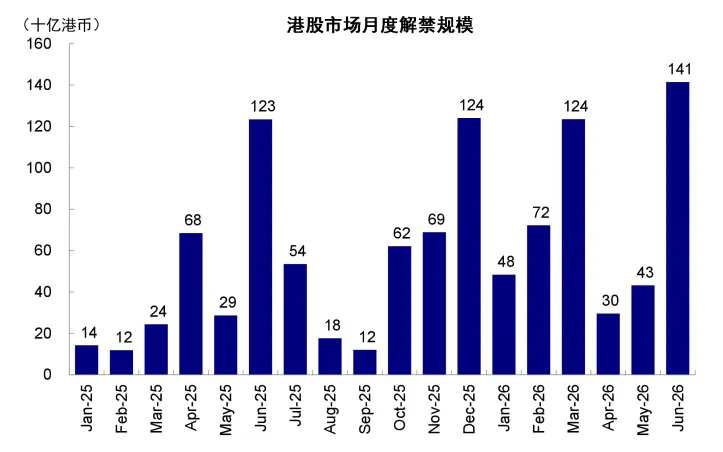
Against this backdrop, the continuous demand for funds in Hong Kong stocks appears even more “conspicuous.” Hong Kong IPO activity remains robust, with several large IPO lock-up periods approaching. By the end of November, cumulative fundraising through Hong Kong IPOs in 2025 reached approximately HKD 260 billion, ranking first among global exchanges. As year-end approaches, Hong Kong IPO activity remains lively, with 20 companies listed on the main board since November, raising over HKD 50 billion. Additionally, companies that went public in the first half of the year are nearing their six-month lock-up period, with potential lock-up releases in December amounting to HKD 120 billion, adding pressure on liquidity conditions.
Chart 5: Hong Kong IPO activity remains active as year-end approaches.
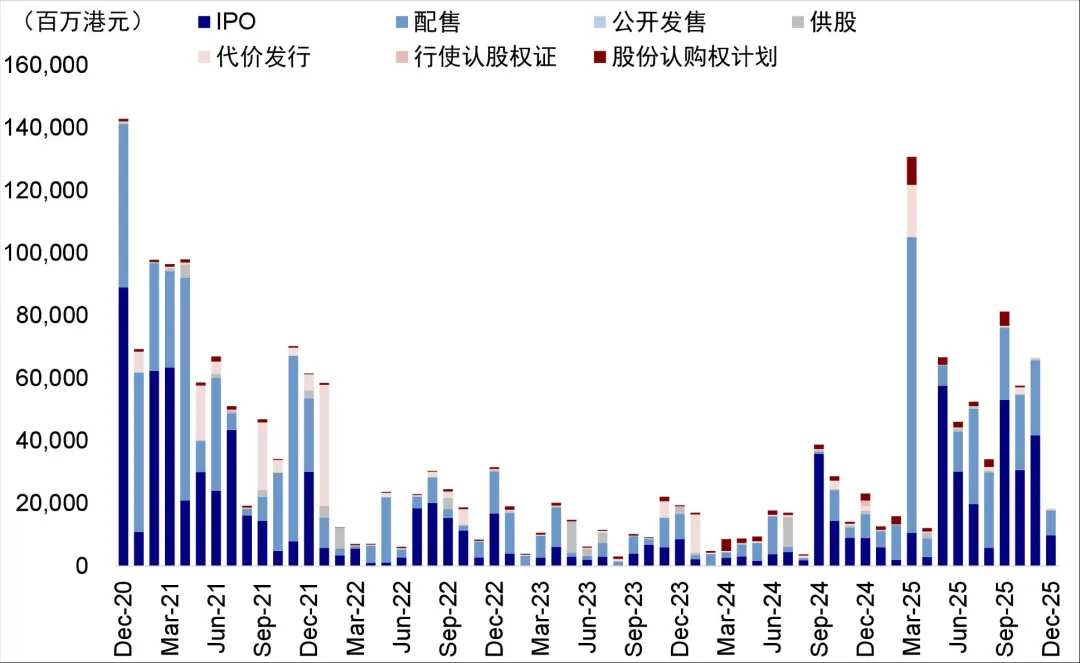
Chart 6: Potential lock-up release in December amounts to HKD 120 billion in Hong Kong stocks.
In summary, short-term liquidity disruptions do exist, but it is not difficult to see that some factors may have been exaggerated by short-term sentiment. For instance, whether actively managed mutual funds will significantly reduce their Hong Kong stock positions directly correlates with expectations about future market performance. While a surge in IPOs brings funding demands, it also increases the supply of high-quality companies, creating both positive and negative impacts—though short-term sentiment amplifies the adverse side. However, one thing is certain: it is precisely the weak fundamentals and lack of positive catalysts that amplify such sentiment, making the market more sensitive to negative news.
Therefore, the root of the problem does not lie in how severe changes in liquidity conditions are, but rather in how their impact is further magnified under weak fundamental conditions, which is directly related to the unique industry structure of Hong Kong stocks.
Among the four major sector categories—dividend, technology, consumption, and cyclicals—technology is dominated by Hong Kong-listed Internet applications, with a smaller share of hardware; consumption is characterized mainly by new consumption trends; cyclical sectors have a smaller weighting than in mainland China’s market; dividend sectors are defensive in nature and have limited impact on market elasticity. Excluding dividends, the true pillars supporting Hong Kong’s market and valuation elasticity are technology (especially AI) and consumption.
Chart 7: Technology and consumption sectors account for a significant proportion of the Hong Kong stock market.
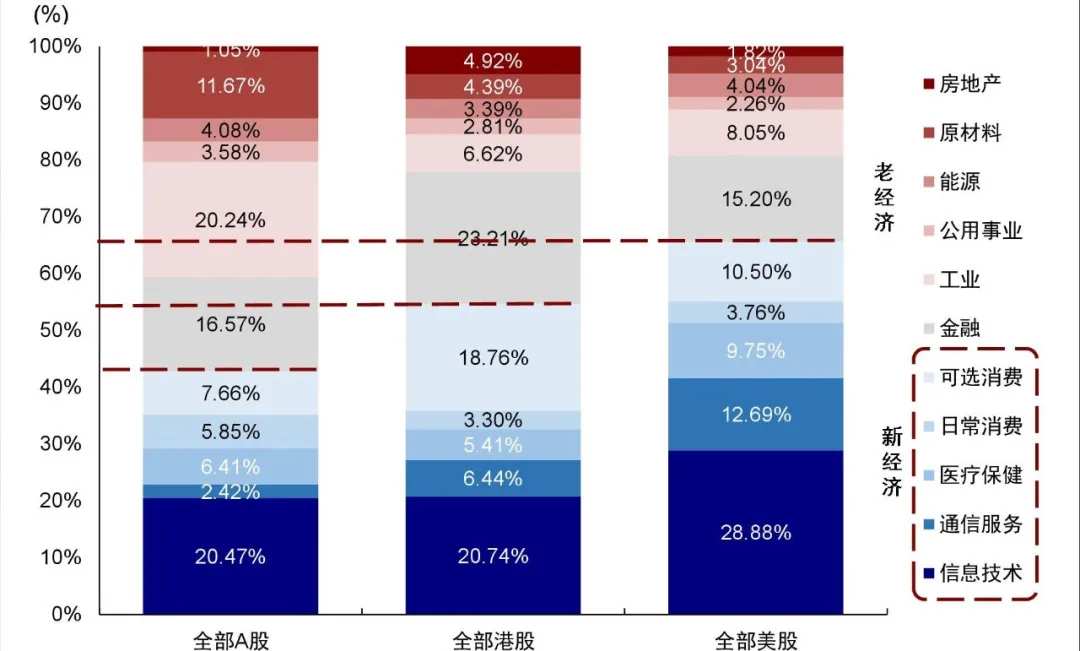
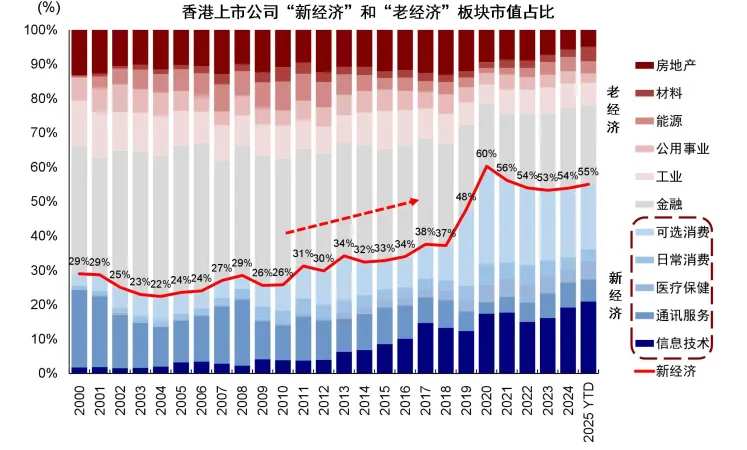
Chart 8: The proportion of new economy sectors in Hong Kong stocks has significantly increased.
1) Technology: The broader environment remains concerned about an AI bubble, and there are also many fluctuations in the US stock market. However, the micro-environment is relatively strong with fewer AI hardware-related stocks in Hong Kong's market. Recent concerns about an AI bubble have persisted, coupled with significant volatility in the US stock market. Additionally, given that expectations and valuations for this sector are not low, AI-related sectors across three markets have been trending weaker. We believe that while AI expectations are high, it is premature to label it as a bubble. Currently, the development of the AI industry is at a stage comparable to 1996-1997 from a demand perspective, similar to 1997-1998 in terms of investment, and akin to 1998-1999 regarding capital market pricing ("How Far Along Is the AI 'Bubble'?"). Nevertheless, concerns about an AI bubble persist, and ongoing fluctuations in individual US stocks have suppressed the overall performance of the AI value chain across these three markets.
Moreover, the composition of Hong Kong stocks is skewed toward applications and internet platforms, meaning greater concentration in the 'application layer' rather than the 'hardware layer' of AI. In contrast, A-shares focus more on AI hardware and domestic substitution, including sub-sectors such as chips and computing power, where visibility of orders, investments, and policy support is relatively high. Even if the application side and monetization of AI underperform expectations, the hardware segment still benefits from stronger certainty and clearer implementation pathways, providing robust support. This also explains why Hong Kong stocks have underperformed A-shares recently, as the higher proportion of hardware in A-shares offers greater resilience.
2) Consumption: The consumption sector in Hong Kong's stock market mainly consists of discretionary consumption. Given the current weak recovery in domestic consumption, along with oscillations or even weakening in the credit cycle and no significant improvement in household income expectations, the consumption sector is unlikely to become a main driver. High expectations earlier this year for new consumption segments have also proven vulnerable. Recently, fundamentals have weakened at an accelerated pace, with the credit cycle's inflection point declining. In September, we highlighted that due to the high base effect from Q4 last year, combined with the inability to effectively repair private credit and the slower pace of fiscal stimulus, China’s credit cycle would likely experience oscillations or even temporary weakening. This has been one of the reasons we have maintained our forecast of 26,000 points as the central level for the Hang Seng Index this year without revising it upward ("China-US Credit Cycle May Face Another Turning Point").
However, the market was relatively optimistic at the time, causing this signal to be overlooked and overshadowed to some extent. The credit cycle is a slow-moving macro variable, but it determines the overall direction of the market, especially when other factors (such as concerns about an AI bubble) and optimistic sentiment dissipate. Moreover, structural characteristics of the Hong Kong stock market make it more sensitive to such changes.
3) Cyclical sectors: Recently, highly cyclical sectors, particularly non-ferrous metals, have performed well but represent a smaller proportion of Hong Kong stocks, making it difficult for them to provide major support.
In summary, Hong Kong stocks, which lack exposure to cyclical sectors and hard technology, are more heavily influenced by the performance of consumption and application-driven technology and are more reliant on fundamental catalysts. When credit cycles recover and risk appetite rises, Hong Kong stocks exhibit greater elasticity. However, once fundamental catalysts are insufficient and the market begins to worry about AI progress and monetization issues on the application side, structural weaknesses in Hong Kong stocks become apparent, making them more vulnerable to pressure. This further explains their recent underperformance.
When has Hong Kong's stock market historically outperformed? Strong beta driven by fundamental recovery and ample liquidity, alongside clear structural opportunities providing strong alpha.
As an offshore market, Hong Kong stocks are more sensitive to changes in liquidity and fundamentals. Historically, this has led to greater rebounds when A-shares and U.S. equities recover, but also deeper declines during downturns. However, since 2024, this pattern seems to have been 'broken.' For example, prior to September 24, 2024, while A-shares were weak, Hong Kong stocks outperformed due to higher dividend payouts. In 2025, as Chinese markets recovered, A-shares outperformed locally due to their higher proportion of tech hardware. This suggests that, in addition to traditional fundamental and liquidity dynamics, comparing the markets of the U.S., A-shares, and Hong Kong requires considering structural differences as well.
Chart 9: When A-shares and U.S. equities recover, Hong Kong stocks rebound more strongly; conversely, declines in Hong Kong stocks tend to be deeper.
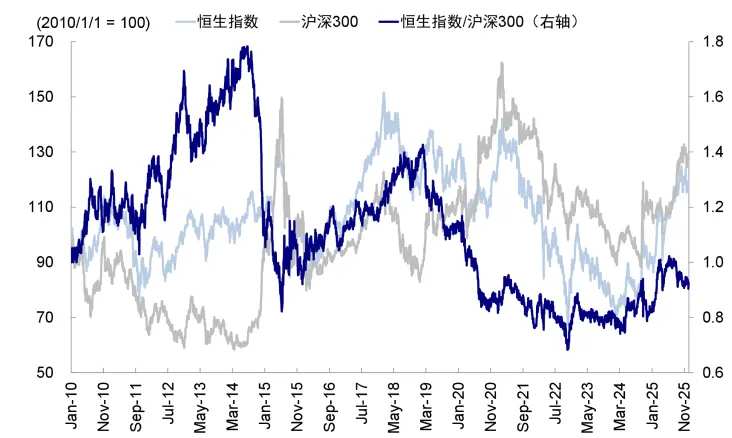
Hong Kong stocks typically outperform when fundamentals recover, external liquidity is ample, or there are clear structural opportunities. Since 2010, periods when Hong Kong stocks outperformed A-shares include early 2010 to December 2012, September 2013 to July 2014, June 2015 to January 2019, October 2022 to January 2023, and April 2024 to June 2025. Key factors driving Hong Kong stocks' outperformance can be summarized as follows:
Southbound capital inflows or external liquidity abundance: During periods of accelerated southbound capital inflows and rising expectations of Federal Reserve rate cuts, the Hong Kong stock market, which is more sensitive to liquidity due to its offshore market characteristics, linked exchange rate system, and lower trading activity, tends to outperform the A-share market. Such phases include January 2010 to December 2012, September 2013 to July 2014, and April 2024 to June 2025.
In contrast, when mainland liquidity is highly abundant and sentiment is elevated, the A-share market benefits more, making it difficult for Hong Kong stocks to outperform. For example, during periods such as the leverage expansion in the secondary market from 2014 to 2015 and the influx of activated deposit funds into the market since June this year, A-shares significantly outperformed Hong Kong stocks.
Fundamental recovery: The periods when Hong Kong stocks outperform A-shares mostly correspond to periods of stabilization in domestic fundamentals or recovery in corporate earnings. The relative performance of the Hang Seng Index/SSE 300 is generally positively correlated with the trend of China's manufacturing PMI. During periods when the index’s dynamic EPS is revised upward, Hong Kong stocks also tend to outperform A-shares. Phases such as October 2022 to January 2023 serve as evidence.
There is a clear structural mainline of scarcity: during periods when Hong Kong stocks outperform mainland China A-shares, most are accompanied by a relatively distinct structural advantage for Hong Kong stocks, including the valuation recovery of internet platforms from October 2022 to January 2023, high dividend yields in 2024, and since 2025, AI, new consumer trends, and innovative pharmaceuticals.Sector Rotation, driving Hong Kong stocks to outperform.
Chart 10: Periods when Hong Kong stocks outperform A-shares
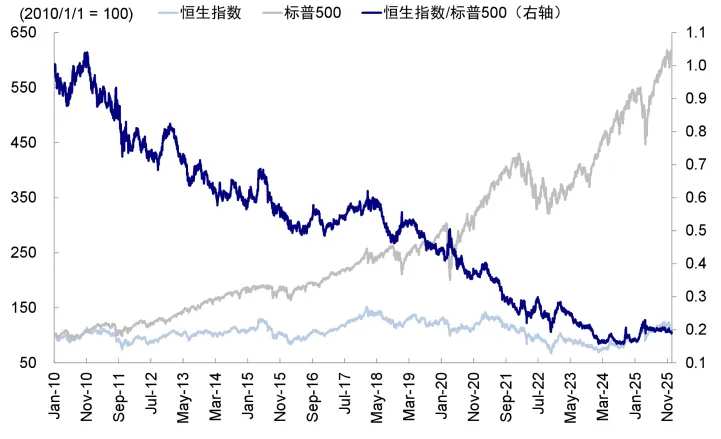
Since 2010, Hong Kong stocks have generally underperformed US stocks, achieving relative gains only in a few phases. The reason why US stocks and the US dollar have stood out globally until 2025 is that the United States was once the only country capable of credit expansion on a global scale (with ChatGPT driving the AI industry at the end of 2022 and sustained fiscal stimulus during Biden's administration), forming the underlying basis of America's "exceptionalism." This continuously attracted global capital inflows, creating a positive feedback loop between capital and the market.
In contrast, the factors supporting Hong Kong stocks' outperformance in certain periods include substantial inflows of southbound funds and the recovery of domestic fundamentals. During phases of accelerated southbound fund inflows, rising China Manufacturing PMI, and upward pulses in private social financing, the Hang Seng Index mostly achieved relative gains over the S&P 500 Index, such as from May to November 2010, December 2016 to March 2018, February to March 2020, and October 2022 to January 2023. Additionally, clear structural opportunities can also provide Hong Kong stocks with chances to outperform US stocks, a notable example being the revaluation of Chinese assets led by the emergence of DeepSeek since January this year.
Chart 11: Since 2010, Hong Kong stocks have generally underperformed U.S. stocks
How to choose among the US, A-shares, and Hong Kong stocks in 2026? Liquidity in Hong Kong stocks depends on spillover effects, fundamentals are weaker than those in the US and A-shares, but structural opportunities exist.
Although our 2026 outlook projects a potential upside of 13-16% for the US stock market ($S&P 500 Index (.SPX.US)$target levels of 7,600-7,800 points) and 8-10% for Hong Kong stocks ($Hang Seng Index (800000.HK)$The overall comparison (at the level of 28,000-29,000 points) appears overly simplistic and somewhat lazy, as it must fully account for differences in liquidity, fundamentals, and structural opportunities across various timeframes and structures.
1. Liquidity: Hong Kong stocks are more sensitive to U.S. easing, but outperformance requires investors in both regions to perceive limited local opportunities.
Ample liquidity in the first half of next year is expected to support the U.S. stock market. On one hand, the Fed initiated balance sheet expansion (RMP) at its December FOMC meeting, deciding to purchase $40 billion worth of short- to medium-term treasury bonds (under three years) in the first month, maintaining a high level in subsequent months, with the pace potentially slowing later. Unlike quantitative easing (QE), which primarily purchases long-term bonds, balance sheet expansion focuses on short-term bonds, directly improving liquidity and boosting risk appetite.
On the other hand, the nomination of the new Fed Chair early next year remains uncertain in terms of policy and stance, but there is a reasonable probability of a dovish inclination. After the nomination is announced, markets may begin pricing in his or her statements and views in advance. Currently, Kevin Hassett is considered the most likely candidate, who is indeed somewhat more dovish than existing Fed officials. Thus, based on both current realities and expectations, the U.S. equity market will not lack liquidity support at least in the first half of the year.
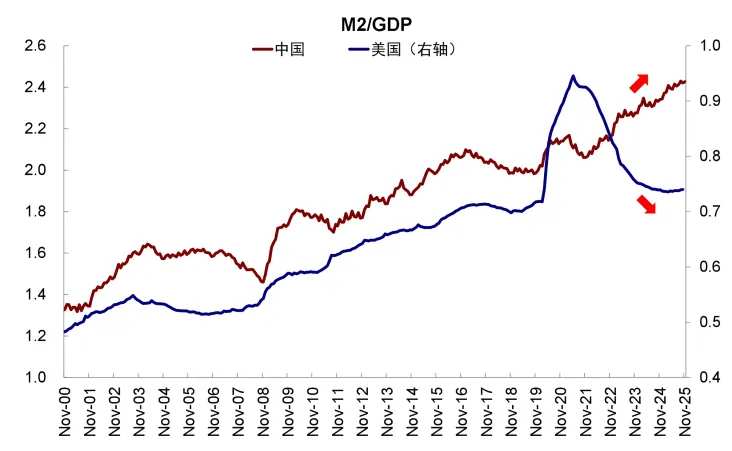
The ample liquidity situation in China's A-share market is likely to persist broadly. First, domestic macro liquidity remains excessive, mainly due to insufficient effective demand. Second, micro-level liquidity is also likely to remain abundant. Although we have consistently advised against overemphasizing the single variable of capital inflows into the market, particularly since the positive feedback loop from wealth effects requires income expectations and real estate performance, recent changes—such as the removal of large-denomination certificates of deposit, adjustments to insurance fund risk factors, and increased leverage capacity for brokerages—continue to signal policy-driven capital inflows. Therefore, assuming overall abundance is reasonable.
Chart 12: Abundant Total Money Supply in China
Hong Kong stocks are influenced by both foreign and southbound capital, but this requires spillover effects, meaning both domestic and overseas investors must perceive limited opportunities locally. 1) Hong Kong stocks are more sensitive to external liquidity changes compared to A-shares. If the Fed unexpectedly cuts interest rates, Hong Kong stocks can directly benefit from the denominator effect, but attracting more overseas inflows would require clear attractiveness in terms of structure and return expectations. In other words, if the Fed only implements mild rate cuts, the effect will be more pronounced, as seen recently. 2) The logic for southbound funds is similar.
Southbound capital inflows into Hong Kong hit a record HKD 1.4 trillion this year. Looking ahead, we estimate that incremental contributions from active mutual funds and insurance funds could reach HKD 600 billion over the next year. Dividend-paying sectors in Hong Kong stocks remain attractive to insurance funds, but greater uncertainty stems from retail investor participation, with potential inflows possibly reaching HKD 500 billion. Adding these together, total inflows may slightly fall below this year’s levels, essentially depending on investors’ assessment of relative returns between the A-share and H-share markets.
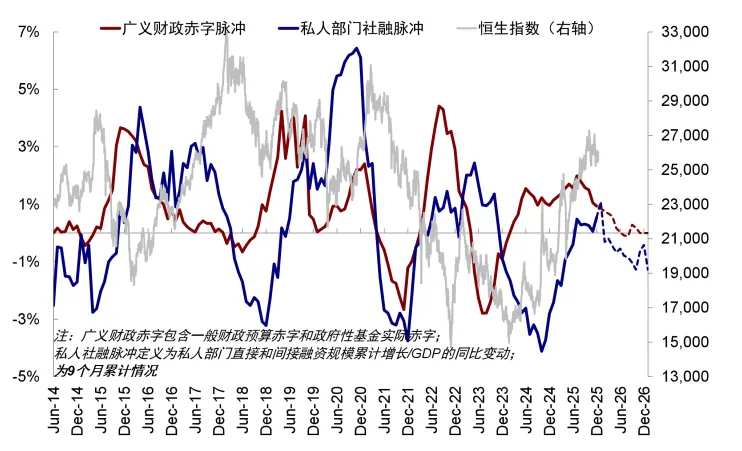
II. Fundamentals: The U.S. credit cycle is recovering, while China’s credit cycle is fluctuating or even weakening; in terms of profitability, U.S. stocks outperform A-shares, which in turn outperform Hong Kong stocks.
We assess that the U.S. credit cycle may gradually recover and even move toward 'overheating' under certain conditions by 2026; meanwhile, China’s credit cycle shows structural vibrancy but, after recovering from the low point of September 24 last year, faces renewed structural challenges leading to volatility or even weakening unless policies significantly strengthen.
Specifically: 1) Differences between China and the U.S. in emerging industries are minimal, with both sides heavily investing in the 'AI race.' This trend is difficult to disprove in the short term, and in some ways, China's policy support may be stronger. Even if AI were to be disproven, both sides would suffer equally.
2) On fiscal policy, the baseline scenario suggests moderate expansion in U.S. fiscal policy, but mid-term election pressures next year could lead to unexpected increases in spending during the first half. In China, it depends on policy intentions and preferences. Based on signals from the 2025 Economic Work Conference, fiscal and monetary policies will 'continue to be implemented,' but the focus has shifted from 'raising the fiscal deficit ratio,' 'sustained efforts, and more powerful measures' in 2024—including timely reserve requirement ratio (RRR) and interest rate cuts—to 'maintaining necessary fiscal deficits, total debt, and expenditure levels' and 'flexibly and efficiently using RRR and interest rate cuts' in 2025. The overall stimulus intention is weaker in 2025 compared to 2024, with greater emphasis on timing and efficiency rather than scale.
3) Regarding traditional demand, the differences between China and the U.S. are most pronounced. Weak real estate and traditional manufacturing in the U.S. are more easily reinvigorated by Fed rate cuts, given the limited gap between costs and returns. In contrast, China’s recovery post-last year may slow again.
Chart 13: The U.S. Credit Cycle Moving Toward Recovery and Potentially Overheating by 2026
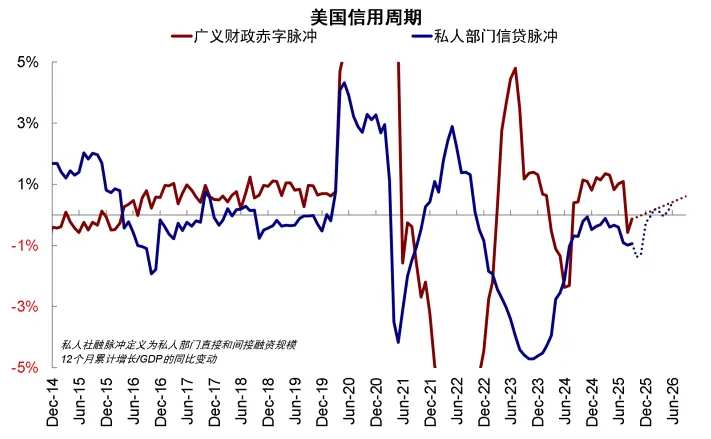
Chart 14: China’s Credit Cycle Fluctuating or Weakening
Against this backdrop, we expect earnings growth in the U.S. equity market to remain high (baseline scenario of 12-14%, consistent with 2025). In the domestic market, the overall credit cycle expansion remains absent, and significant improvement in profitability is unlikely; instead, there will be more structural highlights. We estimate A-share earnings growth at 4-5% for 2026 (non-financial +8%, financial +1.6%), weaker than 6.5% in 2025 (non-financial +4%, financial +9%). Hong Kong equity earnings growth is slightly lower than A-shares at 3% (6% in 2025, current market expectation at 9-10%), with non-financial growth at 6-7% (8% in 2025), and financial expected to show zero growth.
III. Structural Focus: Under the AI theme, hardware visibility is better than applications in the short term; A-shares have stronger cyclicality, while Hong Kong stocks offer superior dividend prospects.
In addition to the overall impact of liquidity and profitability, structural differences are also worth noting, as some phases have even dominated the relative strength of the three regional markets. This analysis starts from four major sector categories: technology, dividends, cyclicals, and consumption.
AI: Short-term certainty in hardware is higher than in applications, with the former being more prevalent in A-shares and the latter more concentrated in Hong Kong equities. As mentioned earlier, we do not believe that AI has entered a bubble phase analogous to the dot-com era.
Currently, US-listed AI investments are characterized by high expectations and valuations, largely based on the assumption of large-scale realization of AI application outcomes. Therefore, the key going forward will be whether the application side can consistently and verifiably translate into revenue and profits. If the pace of realization slows, stock prices may experience volatility, similar to the current situation.
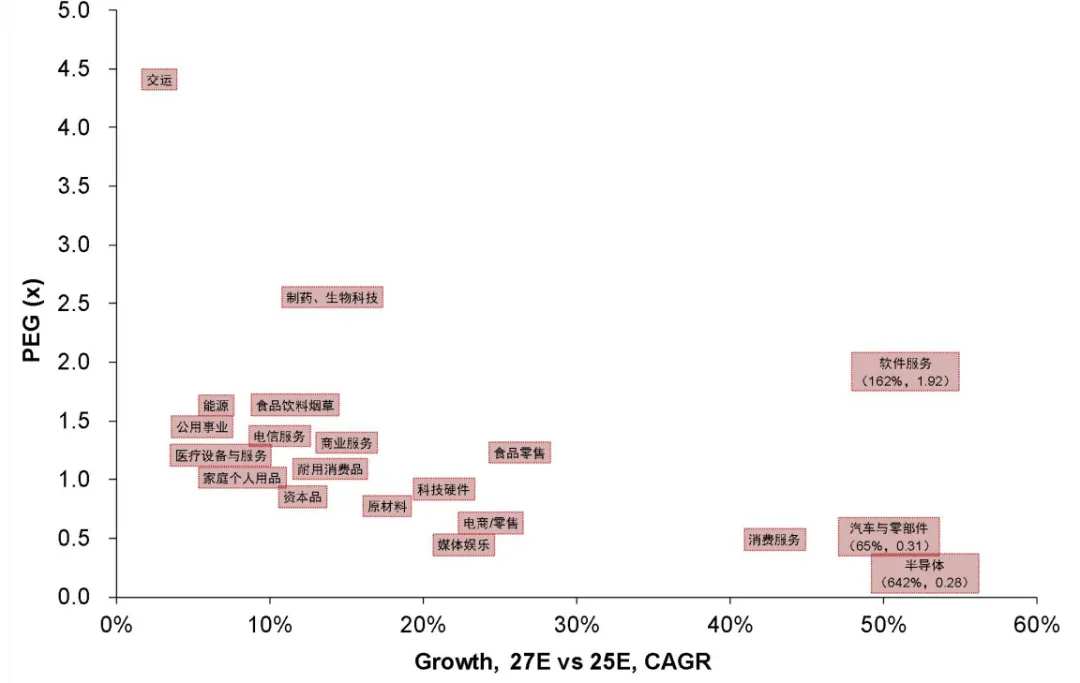
Unlike the U.S. equity market, one characteristic of AI domestically is the relatively high certainty of policy support, particularly in areas such as computing power infrastructure, localization substitution, and supply chain security, where visibility and continuity of policy investment are clearer, even surpassing the U.S. in the short term. However, this policy-driven credit expansion directly benefits the AI hardware sector, especially semiconductors and computing power segments. Moreover, market expectations for earnings growth in hardware (e.g., MSCI China Semiconductor Industry) exceed those for application sectors (e.g., MSCI China Software, Media & Entertainment). Given that A-shares have more hardware exposure, they benefit more clearly in the short term, while Hong Kong equities are more concentrated in internet and application sectors, where profit models remain unclear.
Chart 15: Current market expectations for AI hardware assets are higher than for software.
Dividends: Higher investment value in Hong Kong equities. If the credit cycle reverts to volatility, dividends still hold allocation value to hedge portfolio fluctuations. Dividend yields in Hong Kong equities are higher than in A-shares (for instance, the dividend yield of the banking sector in Hong Kong equities is 6.1%, compared to 4.3% in A-shares), making it particularly advantageous for mainland insurance capital investors who do not need to consider dividend taxes.
Cyclicals: Focus on catalysts in Q1 and Q2, stemming from demand transmission if U.S. fiscal and monetary policies gain traction, along with the lagging recovery window for domestic PPI. Investment opportunities in cyclical sectors are primarily driven by U.S. demand recovery rather than domestic factors. If U.S. fiscal and monetary policies exceed expectations, it could create “overheating” risks, directly benefiting sectors related to physical investment cycles and real estate within the U.S. market, while also boosting performance in resource-related sectors (e.g., nonferrous metals, aluminum, chemicals) and external demand chains (e.g., machinery, chemicals, hardware tools, home furnishings) in the Chinese market, which are more prevalent in A-shares than in Hong Kong equities. Q1 serves as the main observation window, while domestically, there is an information vacuum until the Spring Festival and Two Sessions, leaving only inflation data, with PPI set to rise, potentially offering trading opportunities.
Chart 16: Credit cycle (peak in June) leads M1 by 4 months (October)
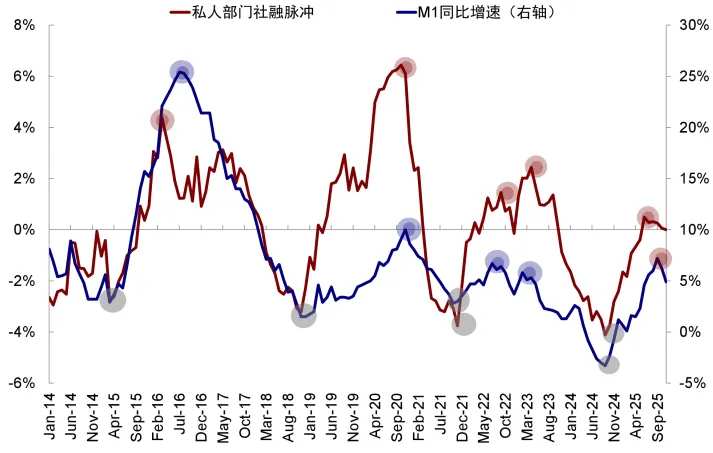
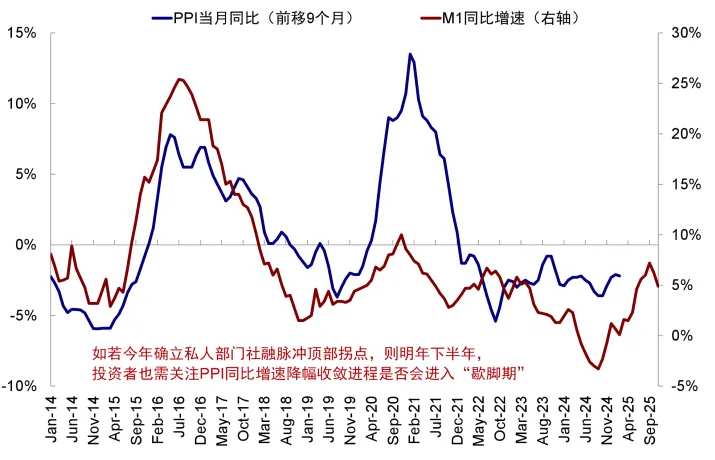
Chart 17: M1 leads PPI by 6-9 months (peak in Q2-Q3 next year)
Consumption: With the domestic credit cycle experiencing volatility or weakening, the recovery slope of consumption remains low. The consumer sector currently lacks fundamental support. Although there are niche themes like 'new consumption,' these stocks are concentrated in Hong Kong shares, where sentiment remains weak and catalysts are lacking. In the current environment, the consumer sector struggles to provide a high-probability structural allocation rationale.
In summary, among the four major sectors mentioned above, we recommend using dividend-paying stocks (mostly in Hong Kong-listed shares) and AI as core holdings (short-term certainty is higher for A-share hardware, while catalysts are still needed for Hong Kong-listed applications). Short-term performance will require industrial catalysts or improved liquidity. In the first quarter, focus on strong cyclical trading catalysts (such as non-ferrous metals, aluminum, chemicals, machinery, and tools, with more exposure in A-shares than in Hong Kong shares), while the consumer sector as a whole lacks fundamental support. For U.S. equities, if fiscal and monetary stimulus measures materialize, cyclicals could catch up with technology stocks. Additionally, small-cap stocks that benefit from cost reductions, efficiency improvements, and economic recovery, as well as financial stocks that stand to gain from increased credit and financial deregulation, are also worth watching.
Editor/melody