
Abstract
In the coming months, inflation in major global economies may rise significantly, with growth facing downside risks, and global assets could encounter new challenges. Compared to the period during the Russia-Ukraine conflict in 2022, the current global supply chain pressure is lower, economic demand is weaker, and the absolute level of inflation is lower. Therefore, we predict that this round of stagflation shock will primarily manifest as a temporary disturbance, with inflation peaks notably below the 2022 levels, and global asset performance will not be as poor as in 2022. Based on forward contracts of petroleum futures, the peak of U.S. inflation this round is expected to occur around June, nearing 4%. We forecast that U.S. inflation will retreat again in the second half of the year. Coupled with growth pressures and financial risks, the Federal Reserve may continue to cut interest rates in the second half. In the medium term, the Fed’s easing trade is expected to return, providing new support for the performance of assets such as stocks, bonds, and gold. We are particularly optimistic about the mid-to-long-term performance of Chinese equities. In the short term (next 1-2 months), markets face triple uncertainty, and it is advisable to maintain a certain cash position. From a probability perspective, gold holds a relatively favorable short-term allocation value compared to other non-cash assets.
Inflation in major economies may rise significantly in the coming months, and global assets could face stagflation challenges.
CICC's multi-asset team projected 2026 last year, and one key divergence from market consensus was our higher inflation forecast for the U.S. compared to the market. We predict that U.S. inflation will rise significantly in the first half of 2026, leading to a temporary cooling of expectations for Federal Reserve rate cuts, which may exert phase-specific pressure on assets like gold, equities, and bonds.
 After tensions with Iran escalated, although the trajectory of inflation and market trends remained close to our previous projections, the magnitude exceeded our expectations. Looking ahead, we forecast that U.S. inflation will surge substantially in the coming months, potentially materializing as early as this week.
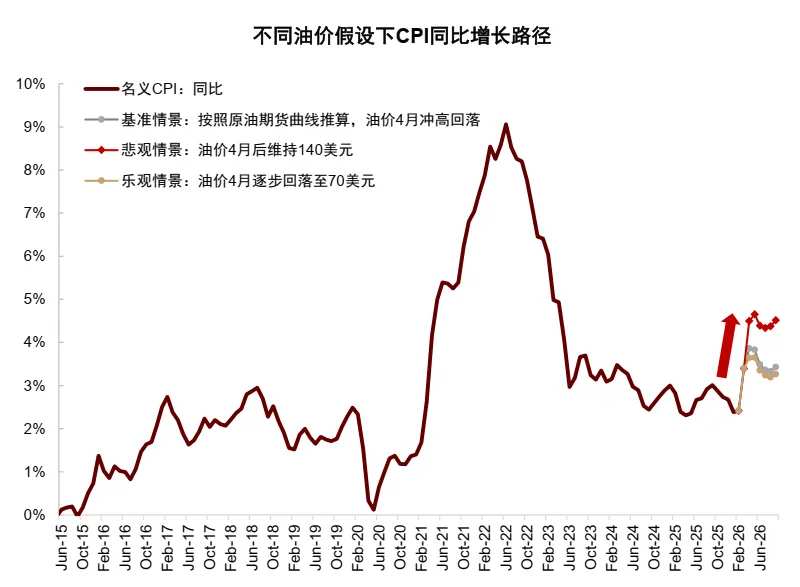
Chart 1: U.S. inflation may rise sharply in the coming months but may retreat again in the second half.
Data Source: Haver, CICC Research Department
The main drivers of rising inflation come from three aspects:
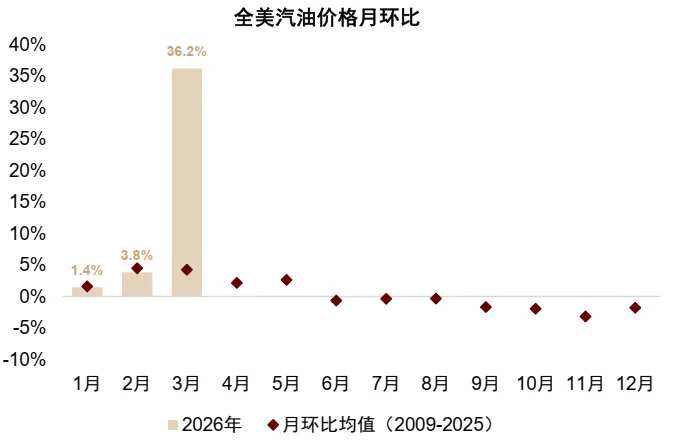
First, the conflict involving Iran caused energy prices to rise counter-seasonally in March, directly pushing up the March U.S. energy and transportation services CPI components, which will indirectly transmit to core goods and food components.
Chart 2: Gasoline prices across the U.S. rose significantly above seasonal norms in March.
Data source: Bloomberg, CICC Research Department
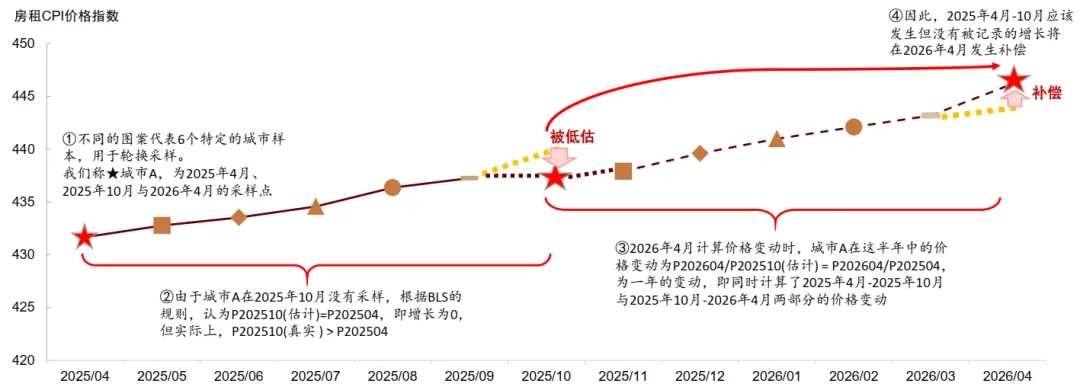
Second, the compensation effect from the rotation of rent samples. The U.S. government shutdown in October-November 2025 resulted in zero recorded month-on-month increase in rent CPI for October. After six months, when rent samples rotate back to those from October of the previous year, the compensation effect of sample rotation will cause a doubling of the month-on-month increase in rent CPI (which accounts for approximately 34%) in April, boosting the inflation reading for that month.
Chart 3: Compensation from rent sample rotation will push up the April inflation reading.
Data Source: Haver, CICC Research Department
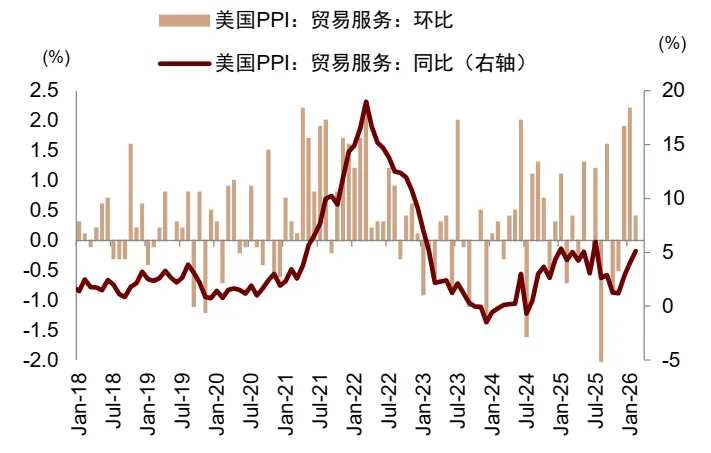
Third, the pressure from tariff costs will continue to be passed on to downstream sectors in the short term, driving up core commodity prices. The sub-index for trade services in the US PPI has risen significantly recently, with the month-on-month increase in January matching the peak of 2.2% seen during the pandemic. High-frequency data also indicates potential strengthening in both used and new car prices, which would exert upward pressure on core goods inflation.
Figure 4: Recent Significant Increase in the PPI Trade Services Sub-index
Data Source: Haver, CICC Research Department
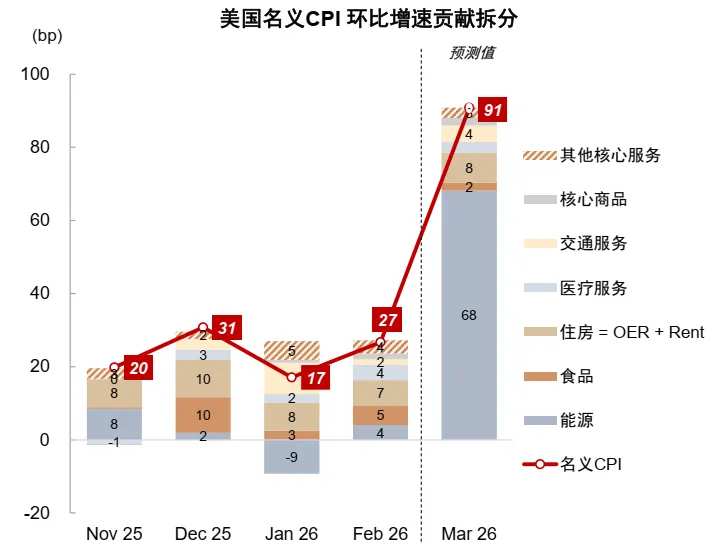
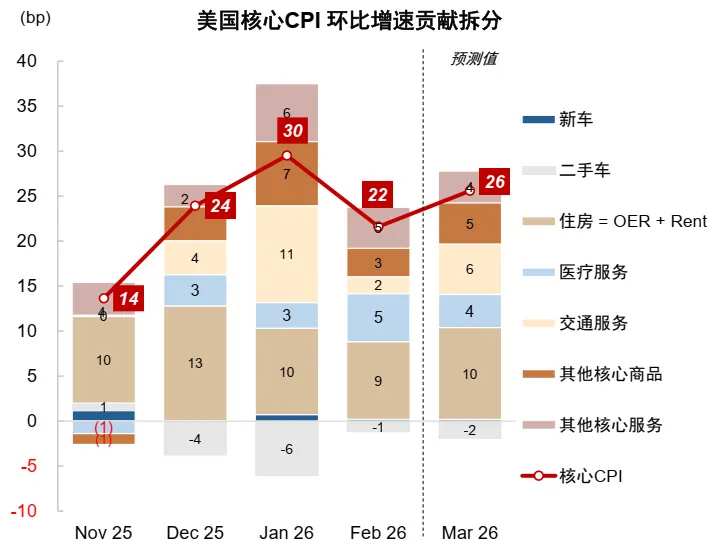
The month-on-month growth of US February PCE, released on April 9, may already be on the higher side, while the March CPI data, to be released on April 10 (this Friday), will provide critical insights into market dynamics following the escalation of tensions with Iran. CICC's multi-asset forecast suggests that the month-on-month growth rate of headline CPI for March is approximately 90 basis points, with the year-on-year rate surging directly from 2.4% to around 3.3%. Consensus market expectations are more pessimistic than our forecast, with the market anticipating a month-on-month rise of 1.0% in headline CPI and a year-on-year increase to 3.4%. The rise in headline CPI primarily reflects the impact of oil price shocks, but the transmission effect of oil prices on core CPI is relatively weak and lagged. We predict that the month-on-month growth of core CPI for March will be close to 30 basis points, remaining largely unchanged from the previous month.
Figure 5: Breakdown and Forecast of Month-on-Month Contributions to the U.S. Nominal CPI
Data Source: Haver, CICC Research Department
Figure 6: Breakdown and Forecast of Month-over-Month Contributions to U.S. Core CPI
Data Source: Haver, CICC Research Department
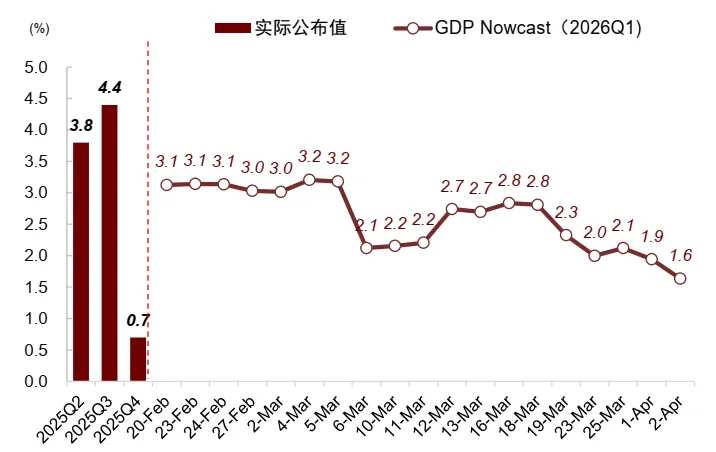
While inflation rises, the US economy will also face downward pressure on growth, leading to a period of 'temporary stagflation.' At the beginning of 2026, the US government’s relaunch should have boosted Q1 economic growth, but rapid downward revisions to consumer goods spending and widening trade deficits have led the Atlanta Fed's GDPNow model to significantly cut its forecast for Q1 2026 GDP growth from 3.1% on February 20 to the latest figure of 1.6%. Looking ahead, intertwined factors such as rising inflation and geopolitical uncertainties may further weaken the US growth outlook.
Figure 7: GDPNow's Continued Downward Revision of the U.S. GDP Growth Forecast for Q1 2026
Sources: Federal Reserve, Wind, CICC Research
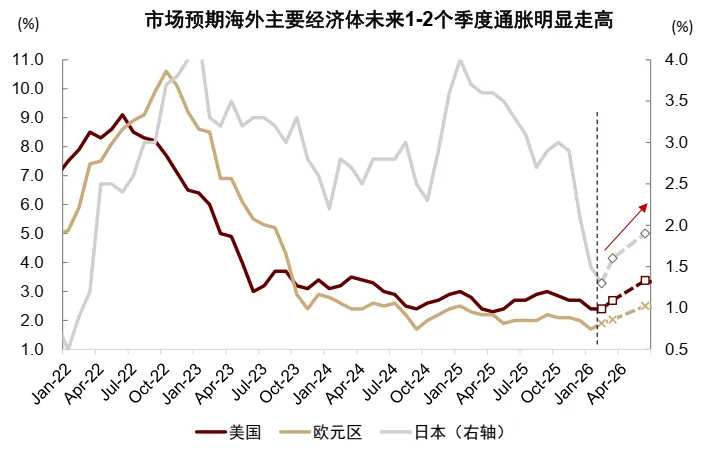
Beyond the United States, inflation forecasts for Europe and Japan over the next one to two quarters have also risen significantly recently. Combined with weaker growth, major overseas economies face a synchronized rise in the risk of stagflation. As upward pressures on inflation mount, markets have substantially revised their expectations for monetary policies of central banks abroad. The implied timing of Federal Reserve interest rate cuts in the futures market has been pushed back to the second half of 2027, with expectations even shifting toward rate hikes in 2026. Similarly, expectations for rate cuts by the European Central Bank and the Bank of England have reversed to expectations for rate increases. China, being in a phase of weak recovery with ample supply and low absolute levels of inflation, may experience a smaller magnitude of inflationary increase compared to Europe and the US, and strictly speaking, it will not enter 'stagflation.' However, supply-side shocks could still impact growth and inflation. Coupled with the fading 'strong start' effect caused by the 'Lunar New Year shift,' Q2 economic growth might slow down.
Figure 8: Market Expectations for a Sharp Rise in Inflation Rates in Europe, the United States, and Japan Over the Next One to Two Quarters
Data source: Bloomberg, CICC Research Department
Chart 9: Market expects major global central banks to reverse rate cuts to rate hikes by 2026.
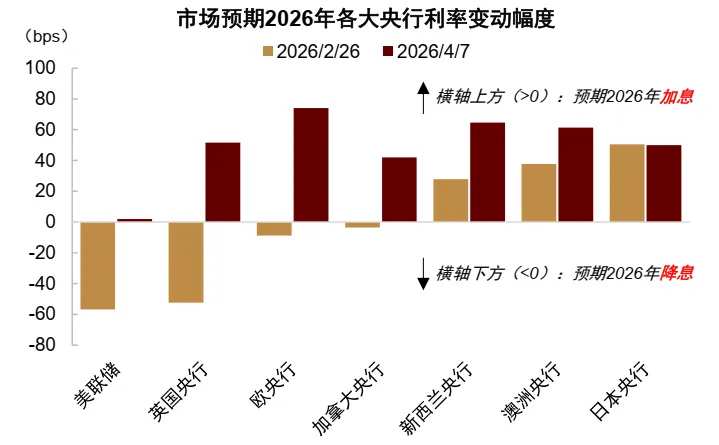
Data source: Bloomberg, CICC Research Department
Paradigm shift in stagflation trading: Decline in asset volatility post-1980s, with gold’s inflation-hedging capability weakening.
Reviewing the four historical periods of U.S. economic stagflation triggered by geopolitical conflicts, the general pattern has been a decline in equity markets alongside a strengthening of the U.S. dollar and commodities. Within equities, performance has varied across sectors, with oil and energy, food, pharmaceuticals, and daily chemical sectors relatively outperforming, while automobiles, durable consumer goods, metal products, and transportation sectors have generally faced pressure.
Chart 10: Median ranking of sector returns during four historical periods of U.S. stagflation.
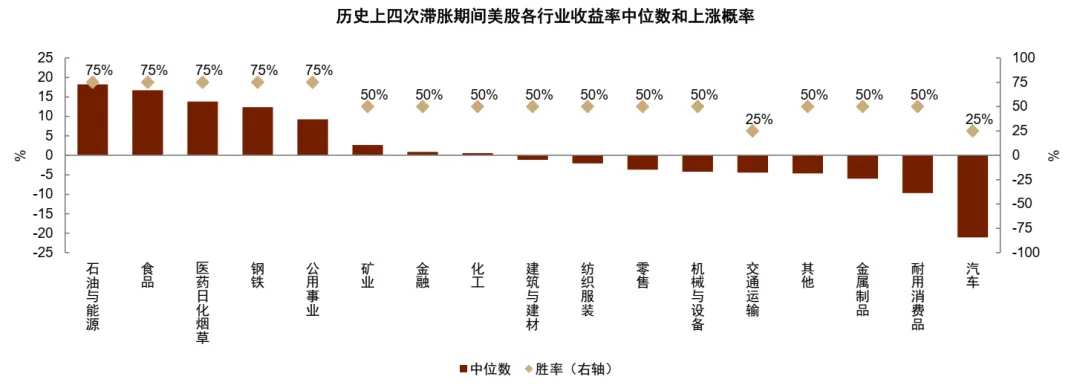
Data source: Bloomberg, CICC Research Department
Chart 11: Asset volatility during stagflation periods declined significantly after the 1980s, with gold transitioning from gains to losses.
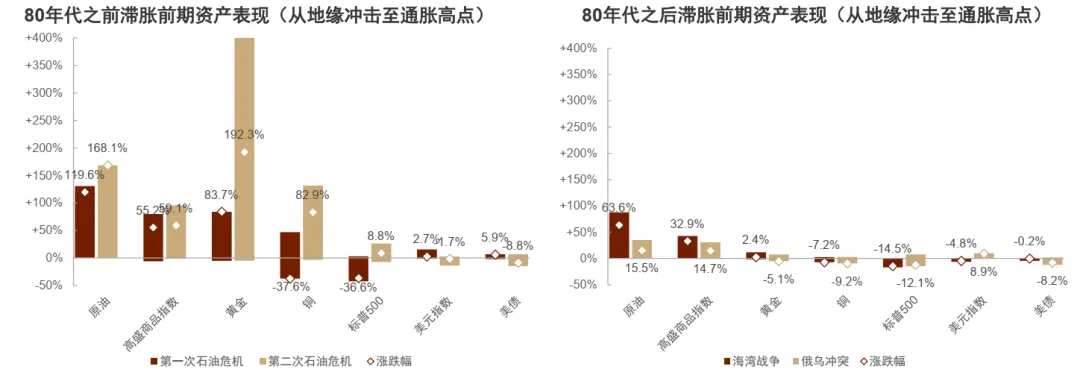
Note: The upper and lower ends of the bars indicate the maximum gains and maximum drawdowns within the event period, respectively, while the marked points represent cumulative gains or losses over the period. Data source: Bloomberg, CICC Research Department.
However, gold's performance exhibited a notable divergence before and after the 1980s. During the stagflation periods following the two oil crises of the 1970s, as central banks in major economies had yet to establish policy credibility, short-term inflation increases would lead to higher long-term inflation expectations. Gold benefited significantly due to its inflation-resistant properties, with its price level markedly rising. However, after entering the 1980s, Paul Volcker suppressed high inflation through aggressive tightening, gradually establishing central bank credibility and effectively anchoring inflation expectations, ushering the global economy into the 'Great Moderation' phase.
Whether during the Gulf War or the Russia-Ukraine conflict, although both events temporarily pushed up oil prices, they did not result in prolonged stagflationary pressures, with the volatility of various assets notably lower compared to the pre-1980s era. As investors anticipated that central banks would suppress inflation by tightening monetary policy, short-term inflation spikes no longer altered long-term inflation expectations but instead created expectations of short-term policy tightening. Consequently, gold’s performance was no longer unidirectionally beneficial; instead, it initially fell before rebounding. Following the escalation of tensions in Iran, the performance of various assets aligned with market dynamics observed after central banks established credibility in the 1980s. Therefore, predicting the market outlook under this round of stagflation hinges on forecasting future inflation trajectories and central bank policy responses.
This round of stagflation may constitute a 'temporary' shock, with U.S. inflation potentially retreating again in the second half of the year. Coupled with slowing growth and financial market risks, the Federal Reserve may continue to cut rates in the second half of the year.
Compared to the macroeconomic and policy backdrop when the Russia-Ukraine conflict occurred, the current state of global supply chains has significantly improved, economic demand is relatively weaker, and initial inflation levels are lower. We expect that the peak of U.S. CPI in this cycle may be significantly lower than the 2022 level, with asset performance unlikely to be as poor as in 2022. Based on forward oil futures contract pricing, the peak of this inflation cycle will likely occur around June, nearing 4%. In an extreme scenario, if oil prices surge to $140 per barrel and remain at that level until year-end, the inflation peak would be approximately 4.5%.
Chart 12: The Global Supply Chain Pressure Index is significantly lower than the levels at the beginning of 2022.
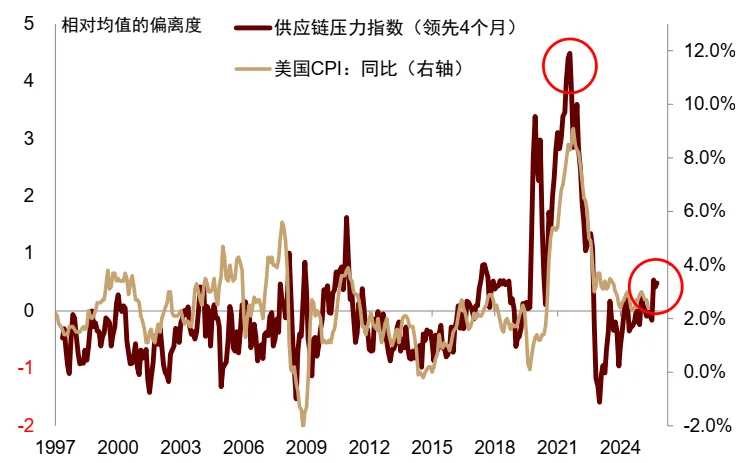
Data Source: Haver, CICC Research Department
Chart 13: US inflation may rise in the first half of the year and decline in the second half, with limited upward pressure from rising oil prices. Even if oil prices rise to $140, it would still be insufficient to push the US CPI above 5%.
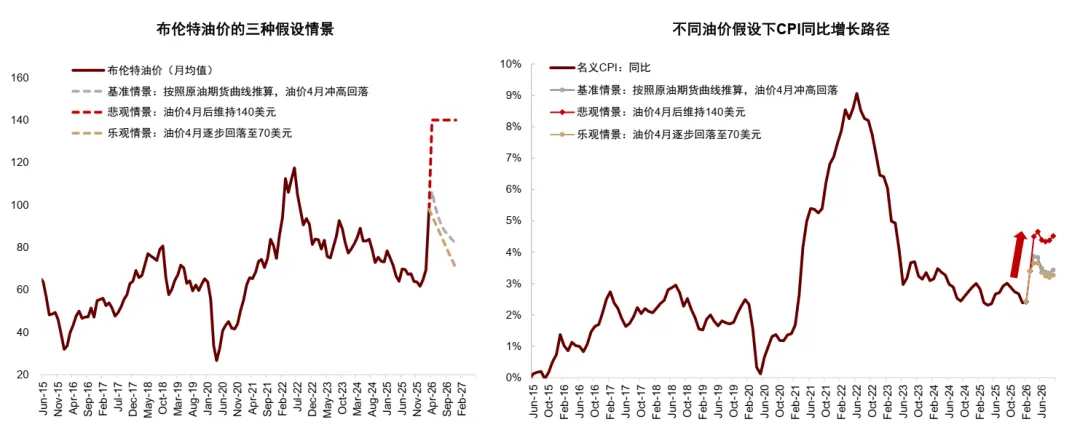
Data Source: Haver, CICC Research Department
If the situation in Iran does not deteriorate significantly, factors such as reciprocal tariff refunds, declining market rents, and cooling economic and labor market conditions may drive the US CPI to fall again in the second half of this year, creating room for the Federal Reserve to resume interest rate cuts.
Compared to 2022, although upward inflationary pressures have relatively decreased, downward growth pressures and the risk of recession have both increased, further raising the probability of Federal Reserve rate cuts. In terms of growth, after the Russia-Ukraine conflict in 2022, US stagflation ultimately did not end in a recession due to rapid fiscal expansion, low unemployment rates, and high excess savings among households. However, the current US economic growth is relatively weaker, fiscal expansion is more subdued, and the risk of recession is higher. If the Federal Reserve significantly increases monetary easing, the economy could avoid the realization of recession risks, and recession trades would evolve into easing trades. Regarding financial risks, the current valuation of US equities, especially in the AI sector, is relatively high and may create a risk resonance with private credit. The vulnerability of financial markets has clearly risen, further increasing the likelihood of the Federal Reserve shifting toward easing.
Chart 14: The US fiscal impulse rose in 2022 and will turn downward by 2026.
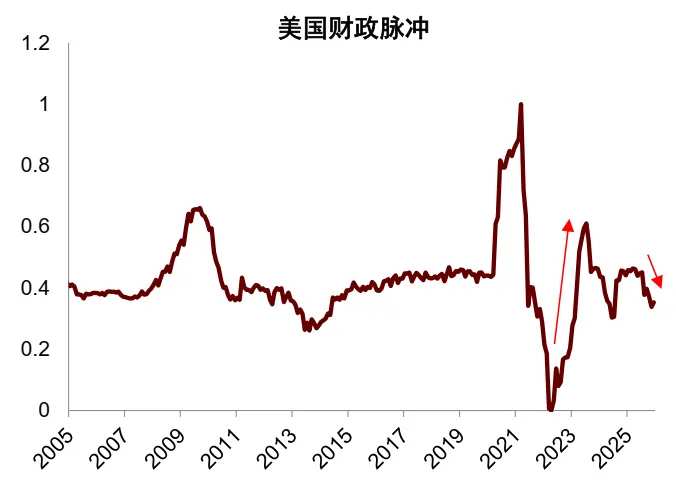
Data Source: Haver, CICC Research Department
Chart 15: Excess household savings in the US have also declined significantly compared to 2022.
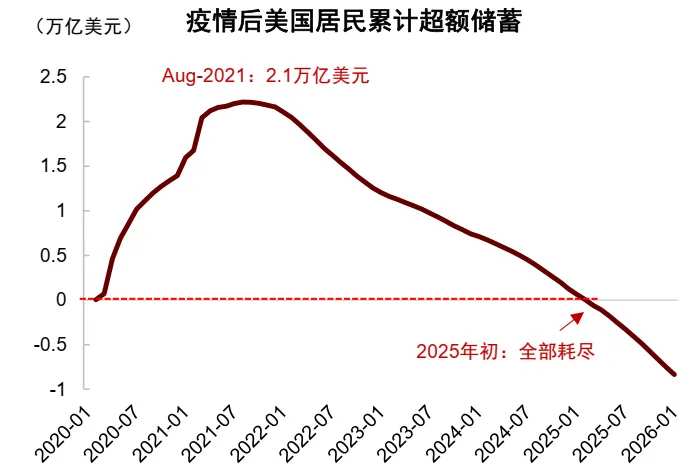
Data Source: Haver, CICC Research Department
Based on our understanding of the new Federal Reserve Chair Kevin Warsh’s policy framework, the future monetary policy paradigm of the Federal Reserve may shift from a backward-looking “data dependence” to a forward-looking approach, increasing the likelihood of rate cuts. In "How the ‘Warsh Shock’ Could Reshape Global Markets," we concluded that Warsh is unwilling to engage in QE or expand the balance sheet, but short-term balance sheet reduction is also unlikely. A more probable path is for the Federal Reserve to increase the magnitude of rate cuts and ease financial regulation, while the Treasury Department issues more short-term debt, forming a new fiscal-monetary coordination mechanism. In summary, despite recent futures market (and market consensus) no longer predicting Federal Reserve rate cuts this year and even pricing in the possibility of rate hikes, we still forecast that the Fed's policy will slow rate cuts in the first half of 2026 and accelerate rate cuts again in the second half of 2026.
Chart 16: Futures markets recently priced in the possibility of the Federal Reserve halting rate cuts and even shifting to rate hikes in 2026.
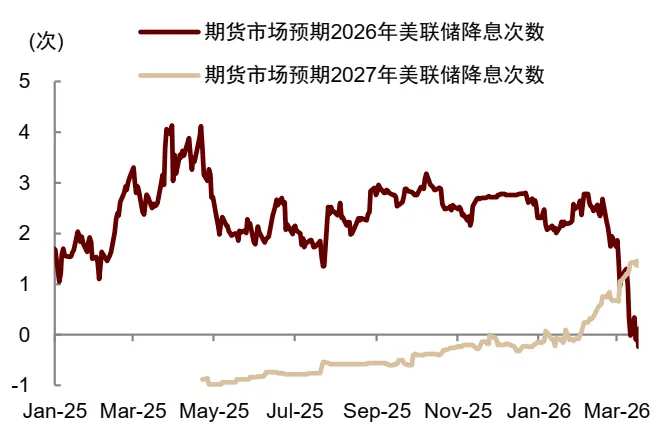
Data source: Bloomberg, CICC Research Department
In the medium term, wait for the return of easing trades; in the short term, adopt a probabilistic mindset to navigate uncertainties.
In the medium term (the second half of this year), given our forecast that the Federal Reserve will resume rate cuts in the second half, we remain optimistic about non-cash assets, expecting Chinese and US equities and gold to re-enter an upward trajectory. Geopolitical shifts have highlighted the advantages of major economies' industrial chains, coupled with China’s leading position in industries such as AI and green transition. We are particularly optimistic about the long-term performance of Chinese equities.
In the short term (the next 1-2 months), the market faces three layers of uncertainty:
First, the evolution of the situation in Iran remains highly unpredictable, with possibilities for both escalation and de-escalation.
Second, overseas inflation may surge significantly in the coming months. The market could continue to correct under concerns of stagflation, or it may already be pricing in high inflation expectations fairly well (for instance, current market expectations suggest a 1% month-on-month nominal inflation rate in the U.S. for March, which is more pessimistic than our forecast). At present, this remains uncertain.
Third, if the new Fed Chair assumes office as scheduled in May, although we expect Warsh might lean dovish, changes in the communication style of the new chair could still lead to misjudgment by the market and risks of overreaction.
Therefore, in the short term, we believe cash still holds allocation value. The absolute return of non-cash assets exhibits higher uncertainty, and can only be assessed from a probability perspective in terms of relative allocation value. The future market can roughly be summarized into three potential scenarios:
In Scenario 1, if the conflict gradually de-escalates through third-party mediation and transportation via the Strait of Hormuz returns to normal, this corresponds to 'Risk-on + Liquidity Trading'.
In Scenario 2, if the U.S. and Iran continue to exchange fire, and Iran carries out limited strikes on the Strait and the Middle East region, but oil transportation and supply are only partially disrupted, this would correspond to 'Stagflation Trading'.
In Scenario 3, if the U.S. becomes directly involved in a larger-scale conflict, the Strait is closed, and global energy supplies are strongly impacted, the market will shift towards 'Recession Trading'.
Chart 17: Main trading themes and asset performance under three potential scenarios
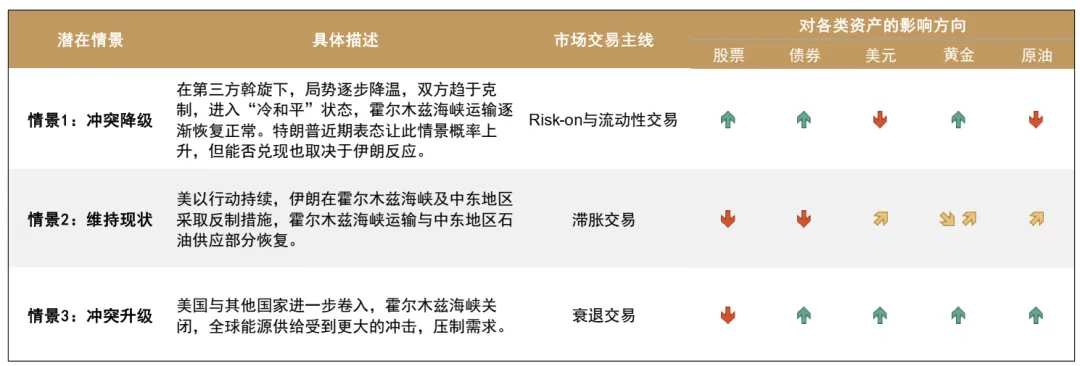
Source: Wind, CICC Research Department
Gold can rise in both Scenario 1 and Scenario 3, while in Scenario 2 it would initially decline before rising. U.S. Treasuries would rise in Scenarios 1 and 3, but fall in Scenario 2. Chinese and U.S. equities would rise in Scenario 1 but fall in the other scenarios. From a probability perspective, gold holds higher allocation value, while equities rank relatively lower.
Even under extreme scenarios, if the major overseas economies fall into prolonged stagflation (Scenario 2), based on market patterns during the Russia-Ukraine conflict, the peak of inflation corresponds to the trough of gold prices. If the current inflation trajectory aligns with our forecast, it is highly likely that gold will confirm an upward inflection point by June or July when inflation peaks. If geopolitical risks ease, expectations of Federal Reserve easing rise, or financial risks emerge earlier, the upward turning point for gold would be confirmed sooner. Over the past three years, CICC's multi-asset team has consistently favored gold but began explicitly warning about adjustment risks for gold toward the end of 2025. After a significant pullback in gold prices, our stance has become more optimistic, believing that gold is gradually entering a favorable buying zone.
Chart 18: Gold Prices Fell First and Then Rose During the Russia-Ukraine Conflict
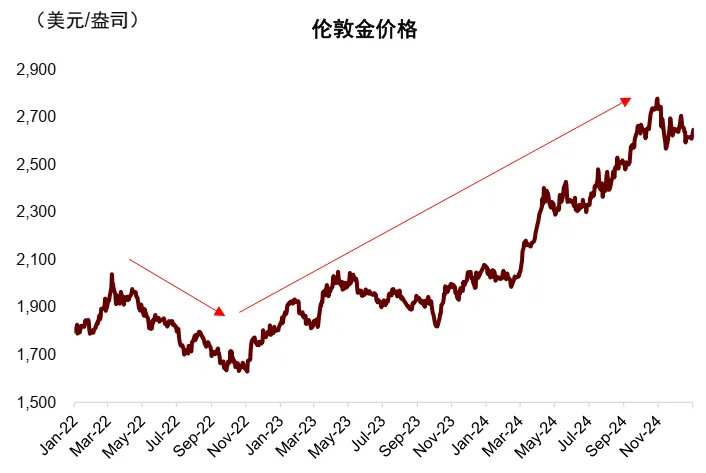
Data Source: Bloomberg, CICC Research Department
Our review shows that after geopolitical conflicts, Chinese equities generally require one to two months to digest negative impacts. In light of uncertainties in the geopolitical landscape, we recommend maintaining caution on position risks in the short term for Chinese stocks.
Chart 19: A-share Market Falls Initially but Recovers Losses in an Average of 60 Days After Geopolitical Shocks
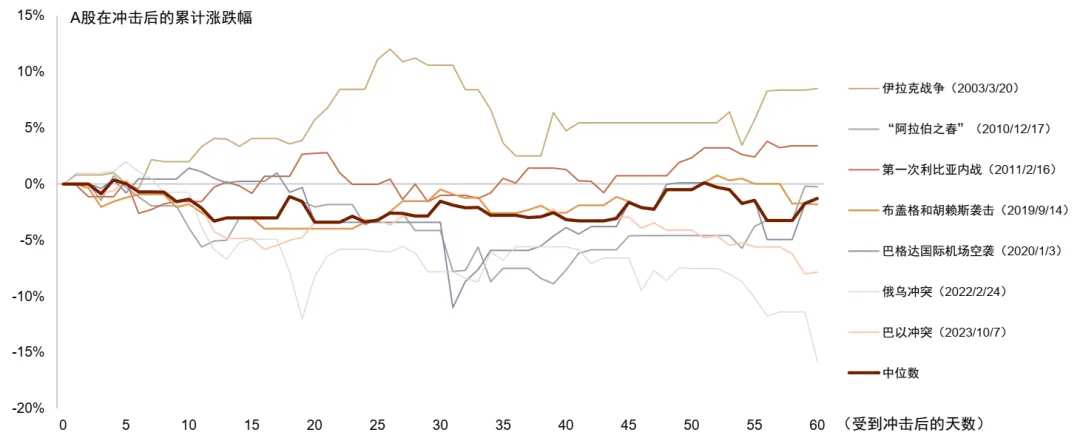
Source: Wind, CICC Research Department
The US stock market faces multiple constraints, including elevated valuations, slowing growth, and rising financial vulnerabilities, making it potentially riskier and less attractive.
Although the US dollar has recently benefited from risk aversion sentiment and stagflation trades, Europe and Japan have higher external energy dependencies than the United States, and their monetary policies are relatively more hawkish compared to the Federal Reserve. Given the divergence in global monetary policy, we believe the strong dollar trend is unlikely to persist. From a medium- to long-term perspective, the weakening trend of the US dollar amid currency order restructuring remains intact.
Chart 20: Europe and Japan Have Higher External Energy Dependencies, While the US Has Lower Dependency
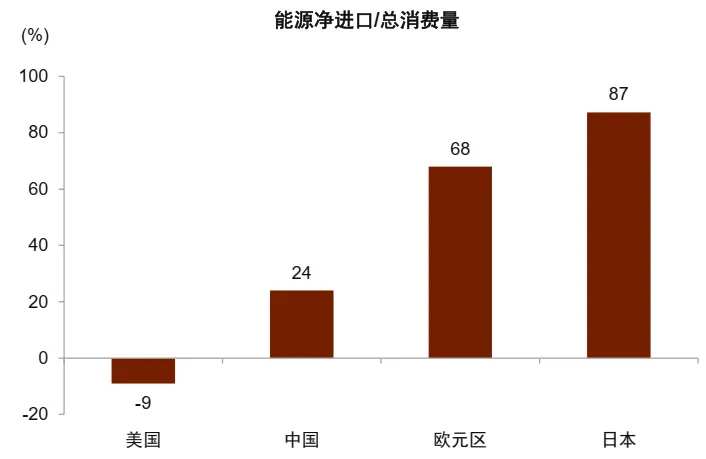
Data Source: World Bank, CICC Research Department
Chart 21: Non-US Stocks Outperform US Stocks During Periods of US Dollar Decline
Data source: Wind, Bloomberg, CICC Research Department
Editor/KOKO