
Source: CICC Insights
Authors: Liu Gang, Wang Muyao
Over the past week, the situation in Iran has rapidly evolved in a direction of de-escalation, which aligns with the default expectations underlying most assets; otherwise, markets would have already started to experience heightened turbulence in recent weeks. This judgment is not difficult to make, as Trump also has the year-end midterm elections to consider and cannot continuously bear high oil prices, high inflation, and financial market volatility. The challenge, however, lies in gauging the timing. Even now, the prospects for negotiations remain murky, and the fragile balance could be disrupted again. This is broadly consistent with our previous baseline assumption: there may be short-term fluctuations, with April being a critical juncture, but a drift toward complete loss of control is not the baseline scenario in the medium term.
In this context, compared to simply relying on luck to 'bet on direction,' we believe a more reliable 'certainty' is the extent to which assets have priced in expectations. This can help guide our asset allocation strategy, and we offer three levels of allocation recommendations: 1) For light positions, consider adding exposure to assets where pessimism has been overly discounted, such as gold, U.S. Treasuries, Hang Seng Tech Index-related securities, and innovative pharmaceuticals; 2) For heavy positions, partial reallocation to low-volatility dividend stocks or reducing overall exposure may be prudent while awaiting better opportunities; 3) Maintain holdings in energy storage, green power, and coal-related assets that stand to benefit, but avoid excessive chasing given their already high consensus positioning. Market performance over the past period has largely reflected these dynamics.
 In this article, we explore another interesting phenomenon: why have the earnings adjustments in the U.S., China A-share, and Hong Kong markets diverged so sharply over the past month despite facing similar shocks from tensions in Iran and high oil prices? Earnings forecasts for U.S. equities were revised upward, those for A-shares remained flat, while Hong Kong equities saw downward revisions. Is the optimism surrounding U.S. equities unwarranted, or is the pessimism toward Hong Kong equities excessive? Answering this question not only involves assessing the adequacy of short-term earnings pricing for geopolitical risks but also relates to the fundamental strength and outlook of the three markets once the current geopolitical risks subside.
Chart: Overall upward revision of U.S. equity earnings expectations, A-share market roughly unchanged, Hong Kong market notably revised downward
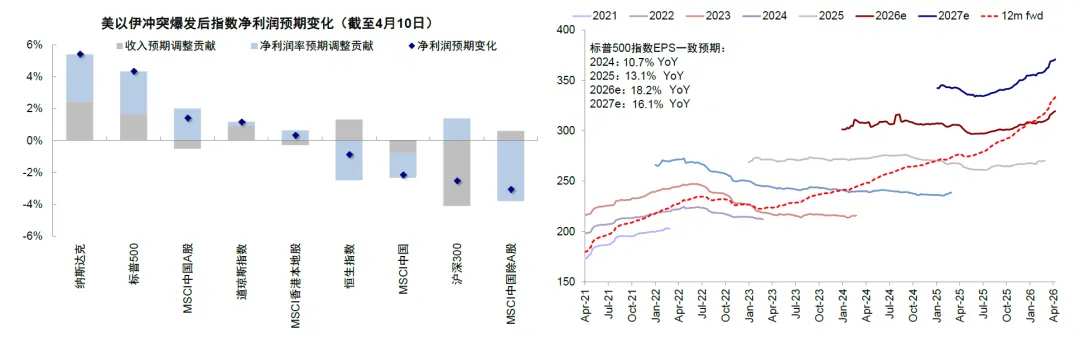
Faced with the same situation in Iran and high oil prices, earnings trends diverged across the three markets: U.S. equities revised upward, A-shares remained flat, and Hong Kong equities revised downward.
Since tensions in Iran escalated, earnings expectations across the U.S., China A-share, and Hong Kong markets have diverged: upward revisions for U.S. equities, stability for A-shares, and downward adjustments for Hong Kong equities. From late February to now, according to FactSet consensus estimates:
1) Upward revisions for U.S. equities: The 12-month forward EPS forecasts for the Nasdaq, S&P 500, and Dow Jones Industrial Average increased by 5.6%, 5.0%, and 2.2%, respectively, seemingly not only ignoring the impact of the geopolitical situation but even appearing to 'benefit' from it.
2) Stability for A-shares: The CSI 300 index saw a 1.6% increase, while the 12-month forward EPS for the MSCI China A-share Index experienced only a slight decrease of 0.1%. Gains in upstream sectors offset pressures faced by mid- and downstream sectors, resulting in a net neutral effect.
3) Pressure on Hong Kong equities: The 12-month forward EPS for the Hang Seng Index, MSCI China ex-A-shares Index, and MSCI China Index declined by 1.3%, 1.9%, and 3.0%, respectively, making Hong Kong the weakest-performing market among the three.
Examining the internal structure reveals that upstream sector earnings improved across all three markets, with larger increases in the U.S. Meanwhile, mid- and downstream sectors in A-shares and particularly in Hong Kong equities experienced significant downward adjustments. 1) Energy and materials sectors saw rising earnings forecasts. According to FactSet consensus estimates, the 12-month forward EPS for the U.S. energy sector increased by 35.2%, significantly higher than the 13.1% for A-shares and 10.1% for Hong Kong equities. In the materials sector, earnings forecasts for A-shares, Hong Kong equities, and U.S. equities rose by 12.5%, 7.9%, and 5.4%, respectively. 2) Some mid- and downstream sectors in A-shares and Hong Kong equities saw earnings downgrades. Technology growth and consumer sectors in Hong Kong equities experienced notable downward revisions, with industries like consumer services, semiconductors, technology hardware, telecommunications services, and discretionary retail seeing their 12-month forward EPS decline by 15.1%, 14.1%, 13.7%, 10.1%, and 7.6%, respectively. In A-shares, sectors such as real estate (-88.4%), automotive and components (-10.6%), telecommunications services (-7.4%), and healthcare equipment and services (-6.9%) also saw downward revisions. In contrast, fewer sectors in U.S. equities were downgraded, with only transportation and durable consumer goods declining by -2.9% and -2.2%, respectively.
Chart: Divergent trends in earnings expectations at the index and sector levels across the three markets
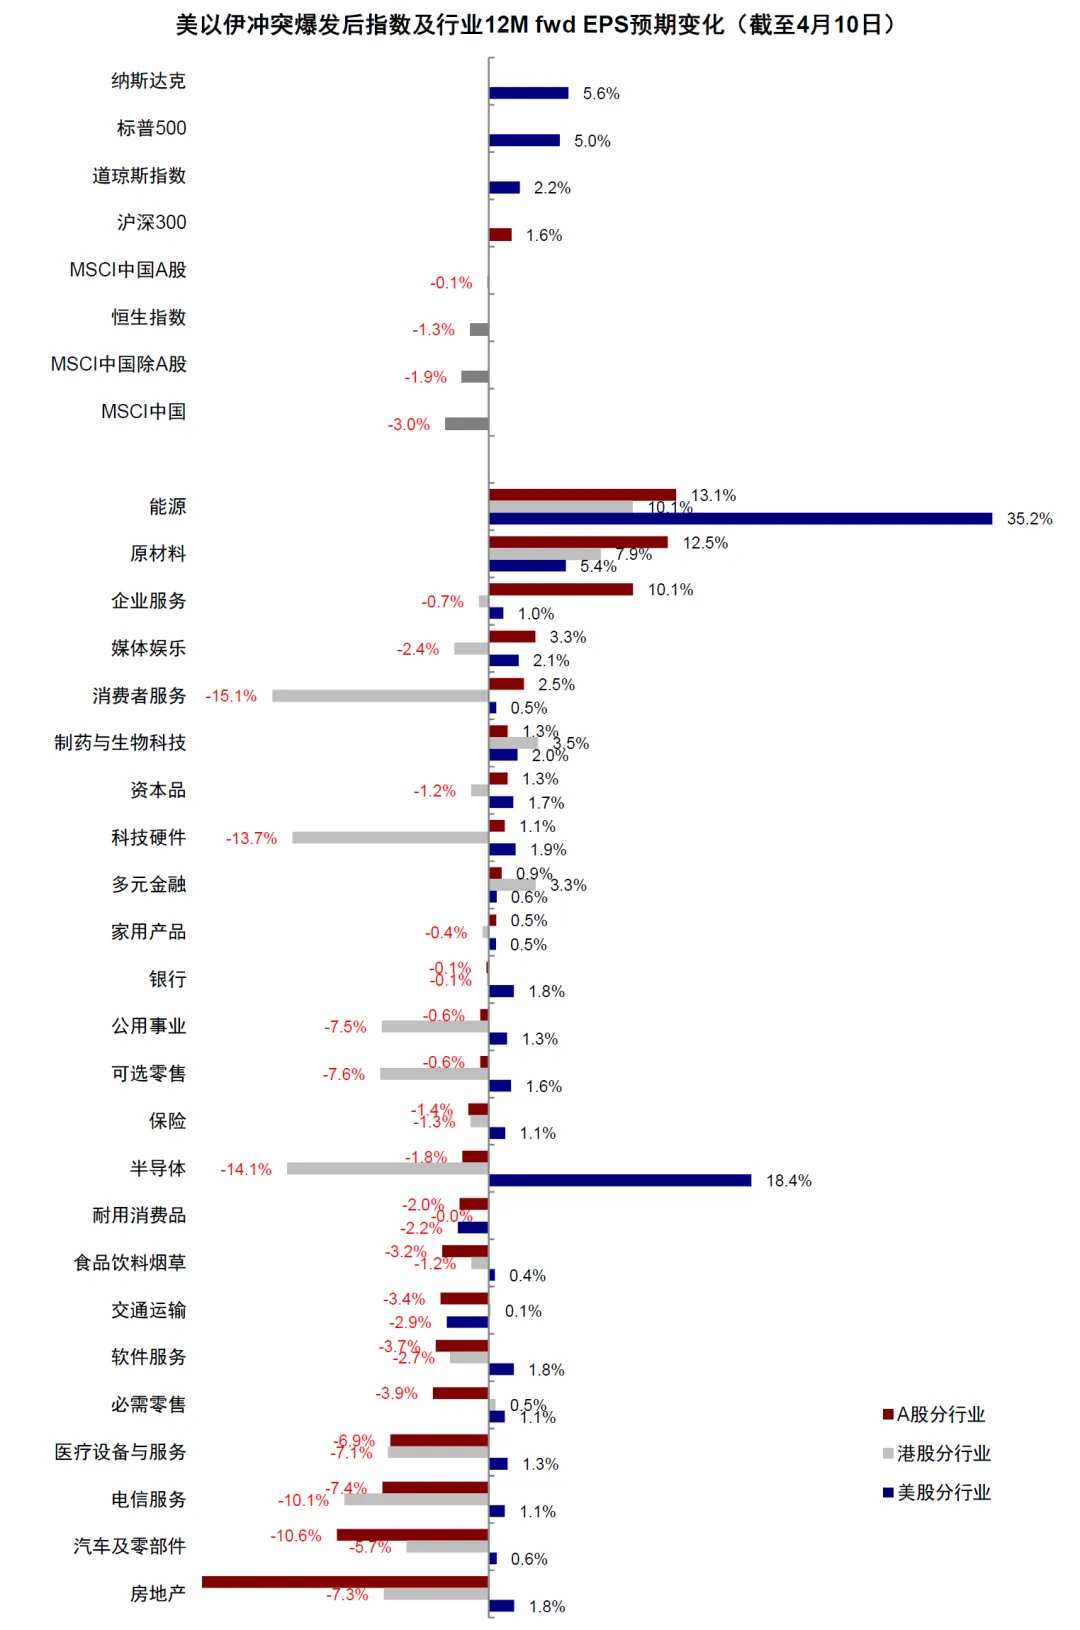
Even within the same sector, earnings adjustments varied significantly across different markets. The semiconductor sector's 12-month forward EPS increased by 18.4% in U.S. equities, decreased by 1.8% in A-shares, and fell sharply by 14.1% in Hong Kong equities. In the technology hardware sector, earnings forecasts rose by 1.9% and 1.1% in U.S. and A-shares, respectively, but declined by 13.7% in Hong Kong equities. For consumer services, earnings forecasts for A-shares and U.S. equities increased by 2.5% and 0.5%, respectively, while Hong Kong equities saw a decline of 15.1%.
Taken together, the key factor behind the overall rise in U.S. equity earnings lies in the larger upward revisions for the energy sector and smaller downward adjustments for mid- and downstream sectors. By contrast, widespread and substantial downward revisions in Hong Kong’s technology and other downstream sectors dragged down overall earnings. So, what are the underlying reasons for these trends, and are they justified?
Why the divergence in profitability across three markets? Energy shocks have a 'time lag,' and differences in market structure amplify disparities.
At first glance, it is perplexing that the profitability trends in the three markets are markedly different despite facing the same geopolitical tensions in Iran and high oil price shocks. Why does only the Hong Kong stock market react, while US stock earnings not only remain unadjusted but even increase? Does this mean the recent surge in oil prices has no impact? To answer this question, two aspects must be clarified: the transmission sequence of external shocks and the internal structures of the three markets.
First, time is a critical variable; energy shocks affect different industries with a 'time lag.' With the Iranian situation lasting less than one and a half months, the duration is relatively short, and the initial impacts have been seen in oil prices and shipping disruptions. In such cases, the impact on profitability will first transmit to upstream sectors and then downstream ones. Upstream resource products are directly influenced by price changes, leading to faster and more definitive adjustments in profitability. Midstream and downstream companies benefit from buffers like inventory, substitution, pricing flexibility, and order backlogs, so they may not revise their full-year guidance in the short term, and the pressure on profitability adjustments may not emerge immediately. This can be corroborated by data showing that earnings in the energy and raw materials sectors, which are upstream, have increased in all three markets, whereas midstream and downstream sectors have not yet broadly reflected the impact. Therefore, if supply shocks persist longer, there is a risk of 'catch-up declines' for midstream and downstream sectors.
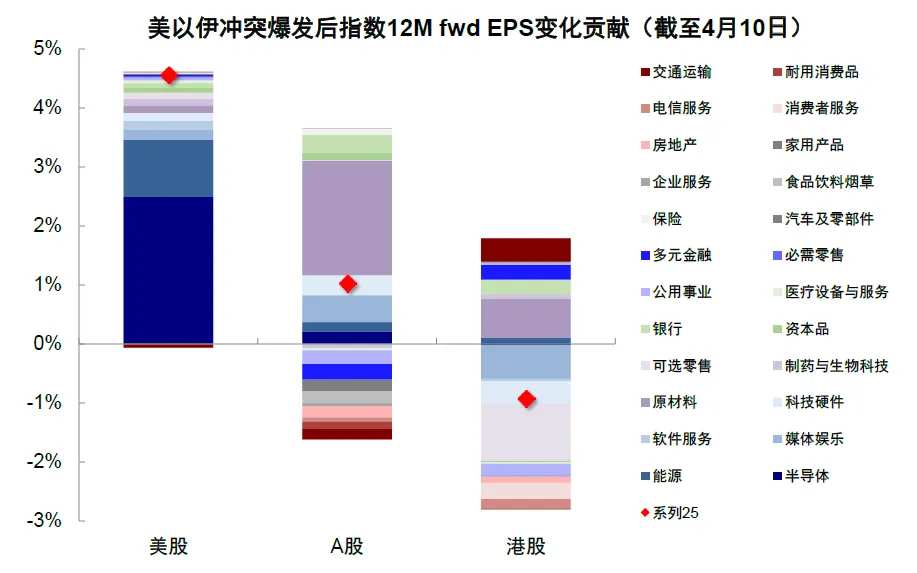
Second, the structural divergence among the three markets also amplifies differences. 1) Although the upstream energy sector benefits in all markets, the upward adjustment is more pronounced in the US. As a major energy producer and exporter, the US stands to gain from net oil exports during this geopolitical shock. The transmission of price changes is more market-driven, resulting in higher profit elasticity for oil and gas companies when oil prices rise. This has led to a significant upward revision for the US energy sector, contributing 20% of the S&P 500's overall earnings upgrade—enough to offset the drag from a few other sectors. 2) The A-share market remains flat because the upward revision in upstream sectors largely offsets downward revisions in some midstream and downstream sectors. 3) The weaker performance in the Hong Kong stock market stems from downward revisions concentrated in high-weight sectors like discretionary retail, media and entertainment, and technology hardware, which dragged down the MSCI China ex-A Index by -1.0ppt, -0.6ppt, and -0.4ppt, respectively. Upon closer examination, these downward revisions were primarily due to lowered earnings expectations for heavyweight stocks like Alibaba, Tencent, and Xiaomi, which are not closely related to the energy shock itself.
Chart: Differences in market structures amplify variations in earnings changes across the three markets.
Profit outlook for the three markets: Under a baseline scenario, US stock growth exceeds that of A-shares and Hong Kong stocks, but none sufficiently price in the potential escalation of tensions.
Looking ahead, the medium-term profit prospects of the three markets will be jointly influenced by credit cycles, industrial structures, and developments in the Iran situation. From the analysis above, it is clear that under a pessimistic scenario, none of the three markets fully price in the escalation of tensions. At present, only upstream earnings adjustments have been factored in, with divergences stemming from the larger upward revisions in the US upstream sector and Hong Kong's inherently weaker market structure. Impacts on downstream industries from prolonged Iran-related tensions remain unaccounted for. Under a baseline scenario, assuming the Iran situation gradually stabilizes, combined with the direction of the US-China credit cycle and market consensus, US stock earnings growth is expected to outpace that of A-shares and Hong Kong stocks.
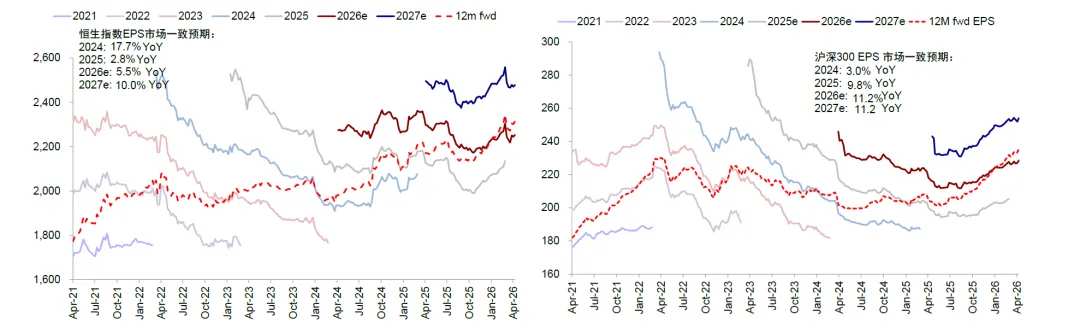
Under the baseline scenario, current market consensus forecasts US stock earnings growth at 18.2% for 2026, A-shares at 11.2%, and Hong Kong stocks at 5.5%. A key precondition is that geopolitical tensions do not escalate further, after which earnings drivers will revert to the respective credit cycles and industrial trends in the US and China.
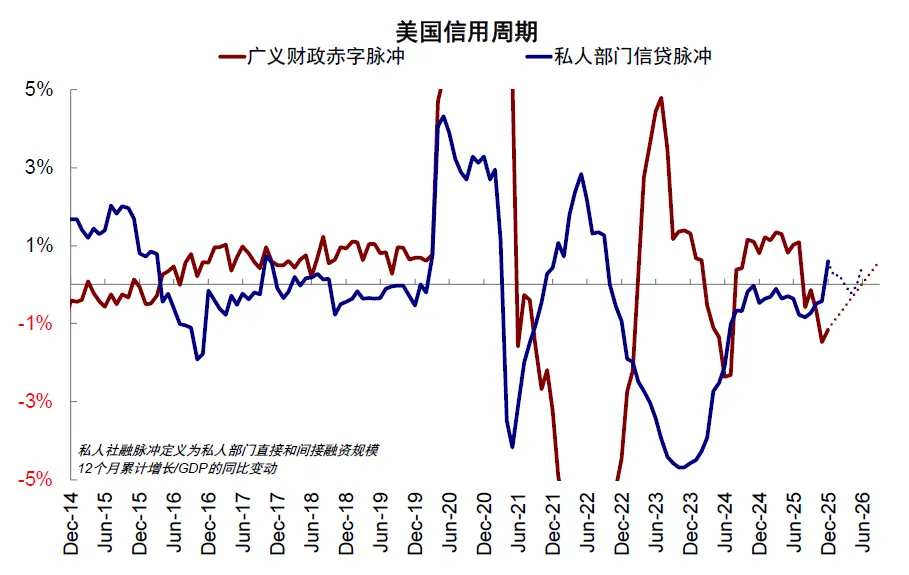
For the US, the Iranian situation delays but does not completely reverse the recovery trend of the US credit cycle. Originally driven by AI technology trends and the dual easing of monetary and fiscal policies, the overall credit cycle was on a path to recovery. However, since the beginning of the year, geopolitical tensions and high oil prices have postponed both fiscal and monetary easing, naturally interrupting the recovery of interest-rate-sensitive sectors like real estate. A de-escalation of tensions with Iran and a gradual decline in oil prices could still prompt the Federal Reserve to cut interest rates, combined with the effects of fiscal expansion, preventing a complete reversal of credit cycle recovery, albeit at a slower pace than expected at the end of last year. We estimate US stock earnings growth at 12-14% for 2026, below the current market consensus of 18.2%. Regarding index levels, if the conflict ends within the second quarter, valuations may recover. However, the rise in oil prices in the first half of the year will continue to weigh on earnings. Considering the delayed recovery of the credit cycle due to the Iranian situation, we have revised our year-end target for the S&P 500 from 7600-7800 to 7100-7200.
Chart: The US credit cycle may gradually move towards recovery.
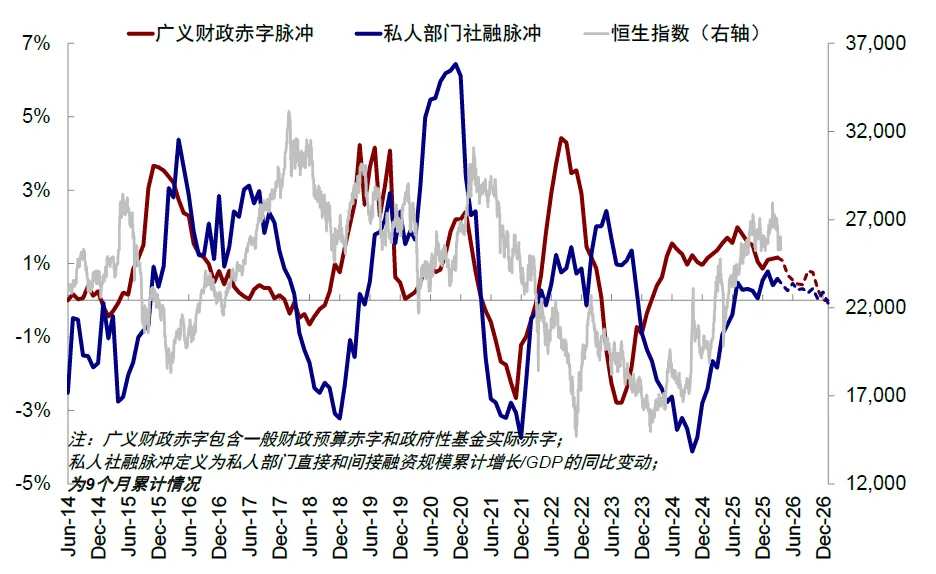
For China, the Iranian situation has not altered the oscillating pattern of the credit cycle unless external demand pressures intensify enough to prompt stronger policy countermeasures. With fiscal stimulus remaining largely unchanged and private sector financing impulses weak due to high base effects, China’s credit cycle may transition to a flatter trajectory. Significant improvement in profitability is unlikely, with only structural highlights expected. We estimate A-share earnings growth at 4-5% for 2026 (non-financial +8%, financial +1.6%, compared to market consensus +11.2%), and Hong Kong stock earnings growth slightly lower than A-shares at 3-4% (non-financial +6-7%, financial approximately zero growth, compared to market consensus +5.5%). Regarding index levels, we maintain our baseline forecast of 28000-29000 for the Hang Seng Index. The flattening of China’s credit cycle in 2026 will constrain overall index upside, and the weaker seasonality of the credit cycle in the second quarter may also bring阶段性压力.
Chart: China’s credit cycle weakened in Q2.
However, under a pessimistic scenario, the pricing of earnings across the three markets for an escalation in tensions remains insufficient. If oil prices remain at a high level of $100 per barrel through the third and fourth quarters, the average oil price for 2026 would increase by 50%. We estimate that US corporate profits could decline by about 9% to 3-4%, and Chinese corporate profits could drop by 12% into negative growth—both significantly higher than what current consensus expectations reflect. This is one reason why we previously judged that some equity markets had not fully priced in pessimistic expectations: the impact of high oil prices and geopolitical shocks on profitability takes time to manifest, and the market continues to hold significant hope for the 'TACO' logic, believing that Trump may still compromise under the pressure of midterm elections in the second half of the year.
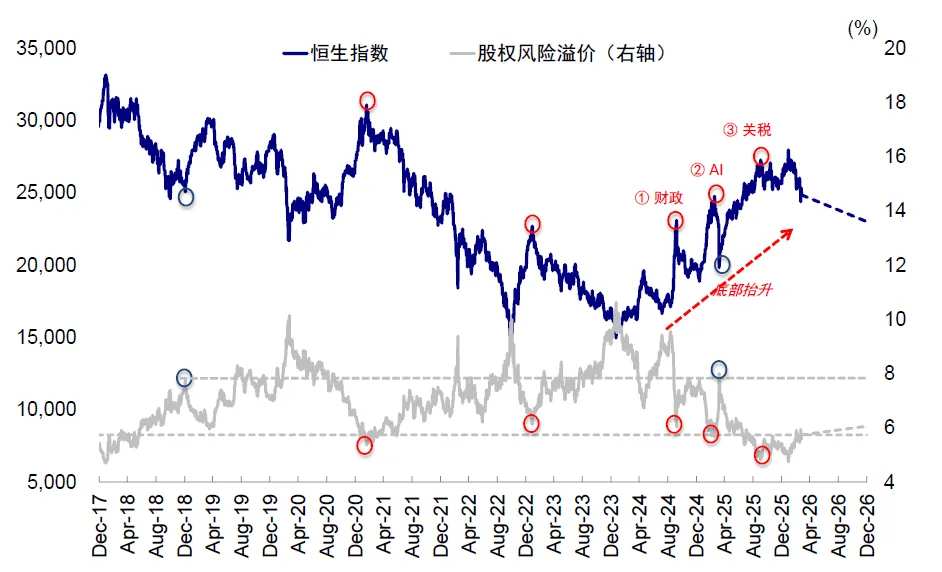
If tensions continue to escalate, and considering that current valuations still incorporate some rate-cut expectations, US stocks could face a correction pressure of 10-15%; for the Chinese market, assuming the Fed does not cut interest rates within the year and US bond yields reach 4.2% by year-end, and referring to the increase in risk premiums following the normalization of the Russia-Ukraine conflict, the Hang Seng Tech Index may face a decline of approximately 6% to 4500-4600 points, and the Hang Seng Index may drop by about 10% to around 23000 points. Different indices in the A-share market may also face varying degrees of pressure depending on valuation and earnings exposure. Of course, if tensions ease, this pressure will naturally subside, as evidenced by recent market performance.
Chart: If the conflict ends in Q2, we will slightly lower our year-end target for the S&P 500 to 7,100-7,200.
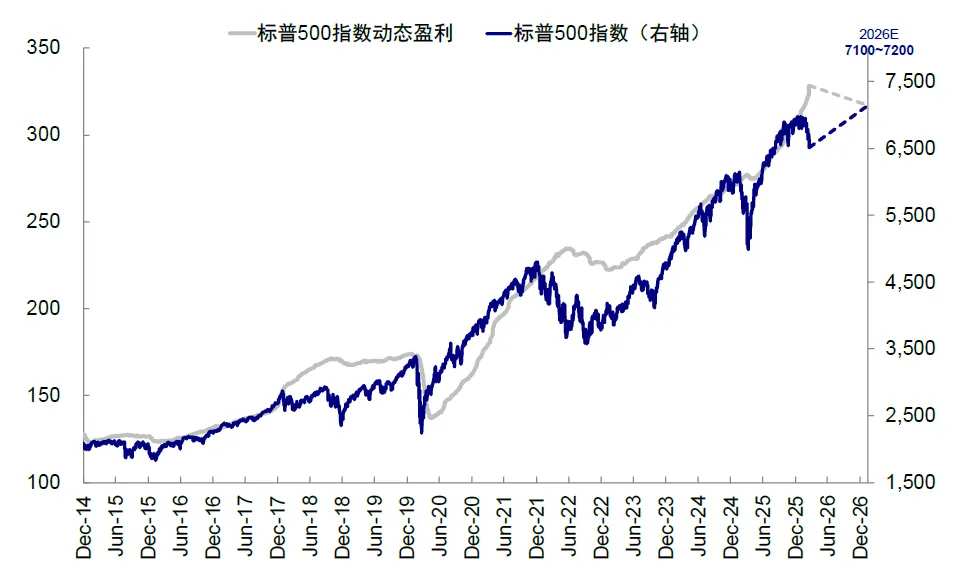
Chart: In extreme scenarios, the Hang Seng Index could fall to 23,000 points.
Allocation Strategy: Choose assets with pessimistic expectations priced in over the short term; follow the direction of credit expansion over the medium term.
From the intense volatility observed across various markets and asset classes over the past month, it is evident that short-term markets are highly influenced by sentiment and evolving situations. Given the inherent uncertainty surrounding news developments and shifts in circumstances, betting heavily on any single direction could prove problematic, with reversals potentially occurring even within a single day. Therefore, a more certain and manageable approach involves assessing how much pessimism is already priced into different assets, positioning oneself advantageously to navigate uncertainties regarding the trajectory of developments—a point we have consistently emphasized over recent weeks.
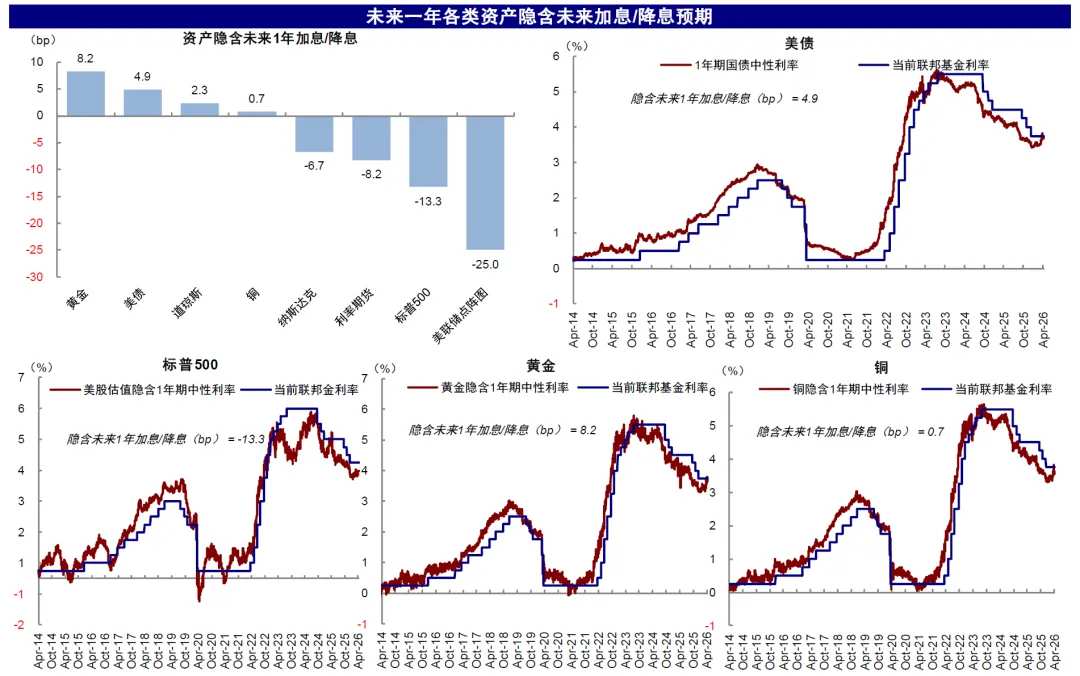
Judging from the extent to which various assets have priced in rate-cut expectations, bonds, gold, and copper remain pessimistic, while equity markets have insufficiently priced in the pessimistic scenario (except for some markets like the Hang Seng Tech Index that have already experienced significant declines). The CME interest rate futures market has adjusted rate-cut expectations from December 2027 to September 2027. By analyzing the expectations embedded in different assets, pricing discrepancies can be observed. The projected magnitude of rate cuts over the next year embedded in current asset prices is as follows: Fed dot plot (-1 cut) > S&P 500 (-0.5 cuts) > interest rate futures (-0.3 cuts) > Nasdaq (-0.3 cuts) > copper (0 cuts) > Dow Jones (+0.1 cuts) > US bonds (+0.2 cuts) > gold (+0.3 cuts). Assets that have priced in excessively pessimistic expectations, such as US bonds, gold, and even the Hang Seng Tech Index, offer attractive 'risk-reward' opportunities for long positions if tensions ease, and even if tensions escalate, the risks they face would be relatively limited.
Chart: Bonds, gold, and copper reflect relatively pessimistic sentiment; equity markets generally underprice pessimistic scenarios.
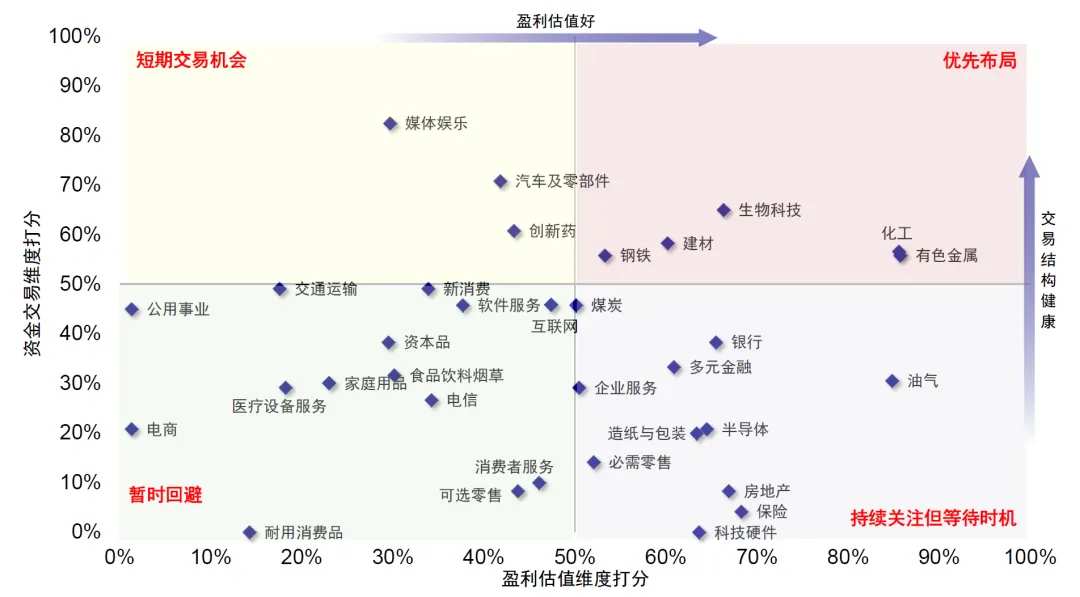
According to our industry rotation scoring model, biotechnology, non-ferrous metals, chemicals, building materials, and steel show strong performance in terms of profitability, valuation, and capital trading dimensions in the short term, making them suitable for priority allocation. Sectors such as banking, oil and gas, and coal demonstrate robust fundamentals but score lower in capital trading, warranting continued attention while waiting for better timing; they are more appropriate as mid-term core holdings or left-side allocations. This model is purely based on short-term data reflecting sector conditions and serves better as an auxiliary reference outside long-term fundamental logic.
Chart: Priority sectors for allocation include chemicals, steel, building materials, biotechnology, and non-ferrous metals.
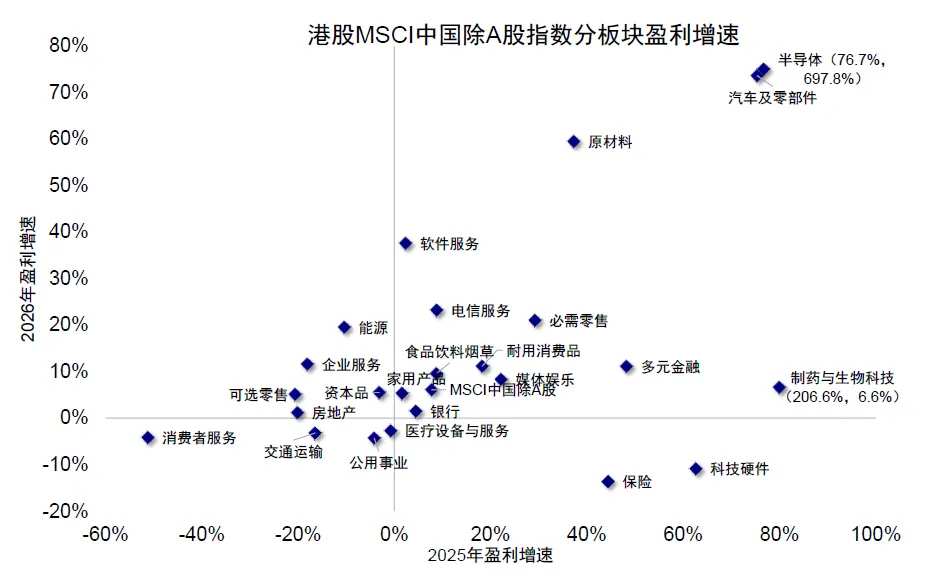
In the medium term, as the situation in Iran gradually stabilizes and sentiment recovers, the determining factor for allocation will revert to profit prospects. Based on current expectations, sectors such as technology, cyclicals, and certain resource-based industries are projected to have higher earnings growth in 2026 across three major markets, while some consumer sectors face pressure, consistent with the trajectory of the credit cycle. Specifically, the US semiconductor (+74.7%), energy (+39.1%), and materials (+29.3%) sectors are expected to see significant improvement in earnings growth in 2026 compared to 2025. In China’s A-share market, semiconductors (+252.5%), materials (+44.5%), and technology hardware (+41.9%) sectors are anticipated to achieve high earnings growth in 2026. In Hong Kong stocks, semiconductors (+76.7%) are expected to lead earnings growth, followed by autos and components (+73.6%) and materials (+59.4%), which also show marked improvements over 2025. However, even with clear medium-term profit prospects, it remains prudent to seek optimal entry points in the short term, aligning with the previously mentioned short-term trading strategies.
Chart: Earnings improvement in U.S. semiconductors, energy, and materials sectors
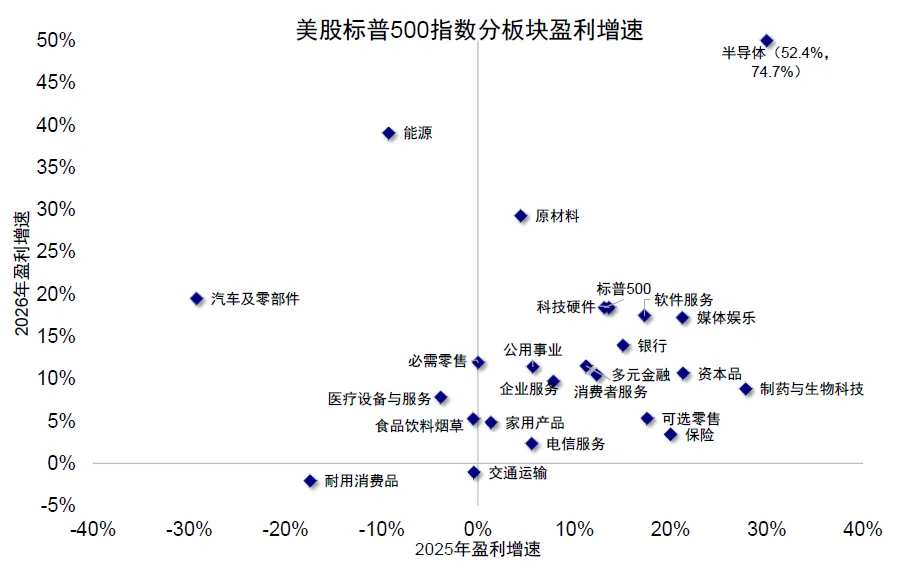
Chart: Earnings improvement in A-share technology and cyclical sectors
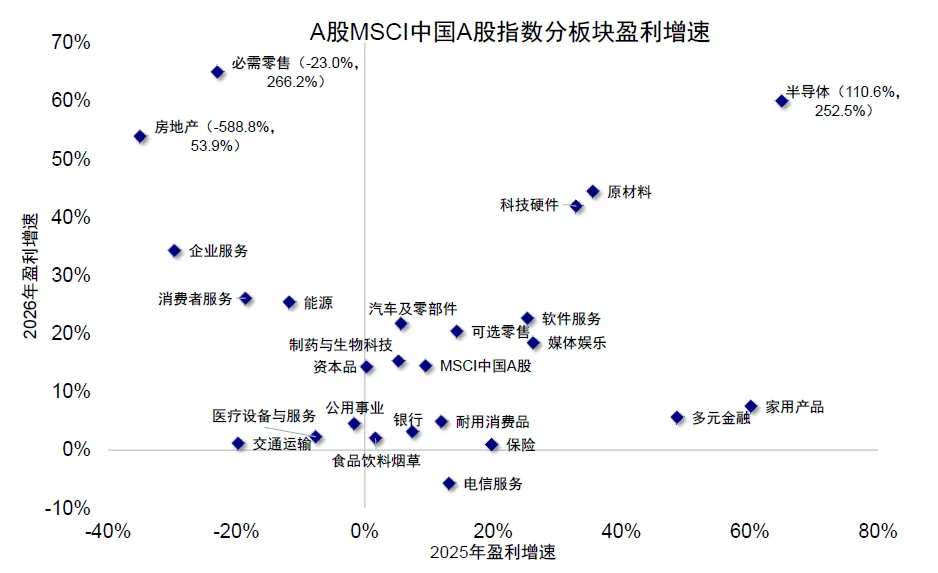
Chart: Earnings improvement in Hong Kong-listed technology and cyclical sectors
In summary, based on several key assumptions: 1) a complete loss of control remains unlikely as a baseline scenario; 2) volatility may persist during the process; and 3) even without considering the situation in Iran, Q2 is typically a weaker phase of China's credit cycle, we recommend that different investors adopt tiered operational strategies to navigate the environment.
1) For investors with low positions, allocate to assets that already reflect pessimistic expectations, are highly correlated with interest rates and risk appetite, and whose valuations are at low levels after deep adjustments, such as Hang Seng Tech, gold, and innovative pharmaceuticals. Since market expectations are already sufficiently low, downside potential is relatively limited. Once the situation eases or extreme scenarios are deemed unlikely, these assets are likely to recover first, making them suitable for left-side allocation. In the medium term, focus on sectors benefiting from clear credit cycle expansion, such as technology and cyclicals, and look for opportune moments to enter.
2) With high positions, part of the portfolio can be adjusted to low volatility dividend assets or reduce positions to wait for opportunities. The credit cycle in the second quarter is relatively weak, compounded by external geopolitical shocks and uncertainties in external demand. Since the overall market has not priced in excessive pessimism, moderately reducing positions can avoid potential fluctuations without missing out too much. Assets such as banks, utilities, and some with stable cash flow and strong dividend certainty can serve as a defensive base. Although these assets cannot provide high elasticity, they can reduce volatility and control drawdowns when the market struggles to form unilateral consensus.
3) Maintain exposure to sectors benefiting from supply shocks and energy security logic, such as energy storage and green power. This configuration approach reflects market consensus, with crowded trading, and excessive chasing should be avoided. If energy prices remain elevated and the market reinforces expectations around resource security and supply assurance, these sectors naturally attract capital inflows and upward momentum. The challenge, however, lies in the fact that expectations for these sectors are already high, and capital clustering is evident, meaning subsequent odds and logic strength may not match. Additionally, if persistently high oil prices lead to increases in fertilizer and grain costs, agricultural products can be incrementally monitored.
 Looking to pick stocks or diagnose stock performance? Want to know the opportunities and risks in your portfolio? For all investment-related questions,just ask Futubull AI!

Editor/Rocky