
Summary
In April 2026, the global cryptocurrency market exhibited structural divergence and phased recovery amid the interplay of three key variables. On the first day after the temporary US-Iran ceasefire agreement took effect on April 9, significant differences emerged—the US claimed that the Strait of Hormuz was "fully open," while Iran restricted daily passage to about 10 ships (less than 8% of pre-war levels). Negotiations collapsed on April 12, causing market turbulence. On April 21, Iran announced it would rejoin negotiations, pushing Bitcoin above $76,000. However, the ceasefire deadline loomed again on April 22. Meanwhile, Trump threatened to dismiss Powell from the Federal Reserve, and Kevin Warsh’s nomination hearing took place, revealing clear hawkish-dovish divisions within the committee. Simultaneously, Morgan Stanley's spot Bitcoin ETF (MSBT) debuted, attracting over $100 million in its first week with a fee rate of just 0.14%, marking Wall Street’s formal inclusion of Bitcoin into its standardized product system. Under the combined influence of these three variables, Bitcoin demonstrated unique resilience in April but faced a technical deadlock and unresolved geopolitical tensions, preventing the market from forming a directional consensus in the short term.
I. Ceasefire Dynamics: The 'Open' and 'Unopened' Status of the Strait of Hormuz
In April 2026, the fate of the Strait of Hormuz once again became a core variable affecting global risk assets. On April 9, the two-week temporary US-Iran ceasefire agreement officially took effect, prompting an immediate optimistic response from global markets: Brent crude oil plummeted from its peak, and Bitcoin briefly exceeded $71,000, triggering the forced liquidation of $427 million in cryptocurrency short positions within 48 hours. However, the 'honeymoon period' of the ceasefire lasted only a few hours.
The content of the ceasefire agreement revealed fundamental disagreements. The Trump administration announced the "full opening" of the Strait of Hormuz, while Iran stipulated that ships could only pass through coordination with Iranian armed forces, limiting daily transits to about 10 vessels. Before the conflict, over 130 ships passed daily, meaning less than 8% of pre-war traffic had resumed. Hundreds of ships remained stranded in the area, effectively trapped.
 More notably, Iran is advancing plans to impose a "toll" on passing ships, charging approximately $1 per barrel of oil and requiring payment in cryptocurrency. This move not only reshapes the global energy transportation cost structure but also signifies Bitcoin’s unprecedented integration into the international energy trade settlement system. Analyst Terry Haines of Pangaea Policy Company aptly remarked: "Whether or not an agreement is reached, this will become the new normal."

On April 12, the third round of negotiations in Islamabad collapsed, with both the US and Iran walking away. Bitcoin fell to near $69,000, and the total cryptocurrency market capitalization shed over $100 billion in a single day. However, on April 17, the situation shifted again as Bitcoin surged to $78,000, triggering the liquidation of nearly 170,000 positions amid intense volatility, with total liquidations exceeding $700 million, underscoring the market’s high leverage and volatility.
On April 21, Iran announced it would send representatives to participate in the second round of talks, prompting Bitcoin to rebound above $76,000. However, as the ceasefire deadline approached again on April 22, both the US and Iran issued strong signals: Iran’s Ministry of Defense spokesperson emphasized that the opening was "temporary," while US Central Command’s General Cooper stated that the blockade would "remain in place until the president orders its removal." US stocks closed sharply lower, with the Dow falling over 290 points, and the cryptocurrency market also came under pressure. Whether the ceasefire agreement can be extended will be the most critical external variable for the cryptocurrency market in the coming weeks.
II. Fed Leadership Crisis: Policy Independence Faces a 'Trump Moment'
In April 2026, the Federal Reserve was experiencing one of the most complex political pressure moments in modern history. On April 15, Trump explicitly stated that if Powell did not voluntarily step down after his term expired in May, he would "have no choice" but to dismiss him. This statement directly impacted market expectations regarding the Fed’s policy independence, causing the US Dollar Index to weaken in the short term and gold to rise above $4,800 per ounce.
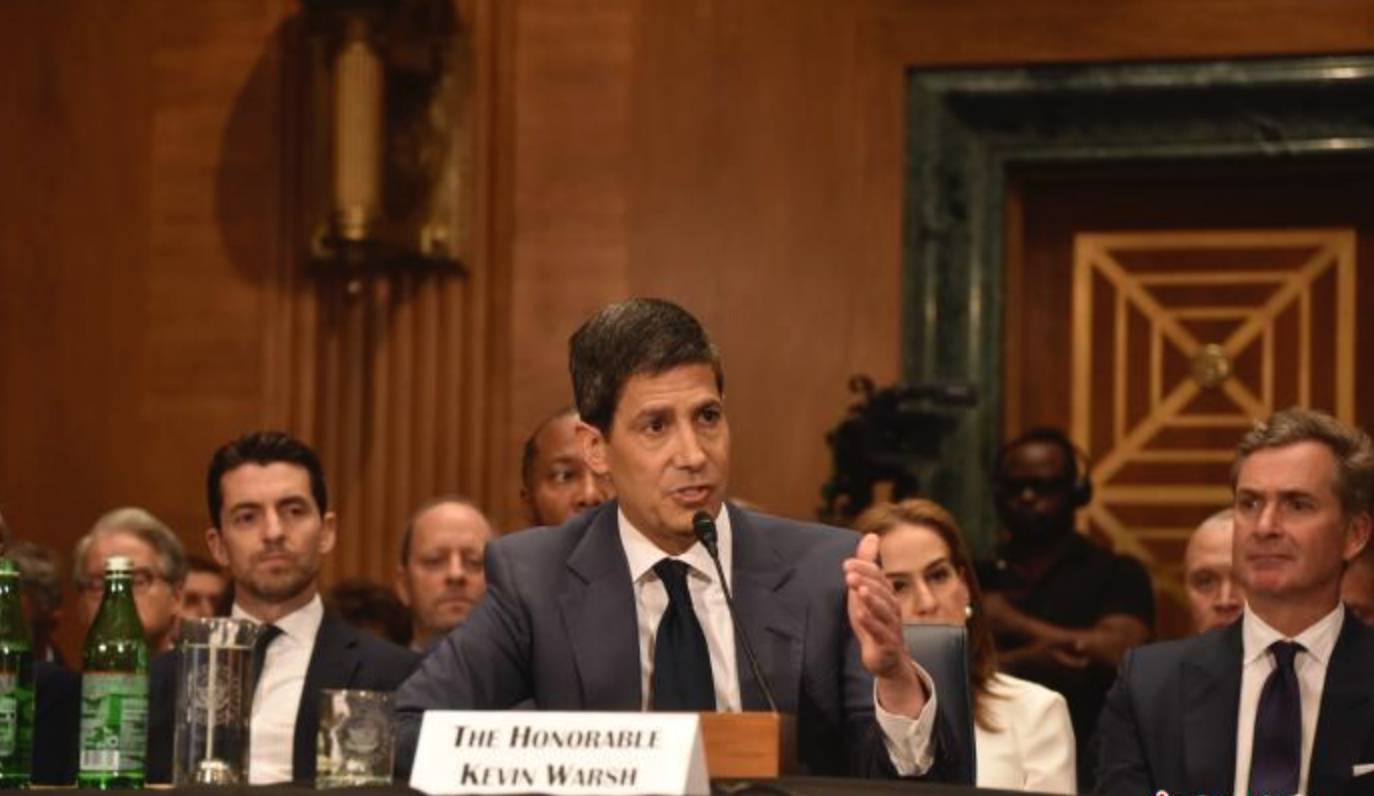
Kevin Warsh’s confirmation hearing for the position of Federal Reserve Chair was held on April 21. Warsh, who holds over $100 million in fund investments, is considered more inclined to align with Trump’s interest rate cut demands. Senator Tillis announced he would block the nomination unless the criminal investigation into Powell was revoked, casting a political shadow over the entire succession process.
The divergence within the Federal Reserve's policy-making body is also evident. Hawkish member Daly warned of a potential rate hike if an energy shock from the Middle East further amplifies inflation; Chicago Fed President Goolsbee suggested that the timeline for rate cuts might be postponed until 2027; dovish governor Milan argued that there should be three to four rate cuts this year, stating "there is no reason to keep waiting." Neutral-leaning Williams stated that the current policy is "well-positioned" and does not require urgent adjustments. The Fed's Beige Book for April revealed that most districts experienced mild to moderate economic growth, but energy and fuel costs rose "significantly" across all 12 districts, with businesses widely reducing hiring and capital expenditures.
In terms of market pricing, a Bank of America survey showed that 58% of institutional investors still expect the Fed to cut rates within the next 12 months; CME FedWatch data indicates the probability of a rate cut in September rebounded to around 55%, up from 40% at the end of March. For crypto assets, the tension between "expected rate cuts but actual tightening" suggests that the narrative of liquidity recovery remains relevant, albeit with a delay compared to earlier expectations. The uncertainty surrounding leadership changes at the Federal Reserve will make this process highly unpredictable.
III. Acceleration of Institutionalization: The Historic Significance of Morgan Stanley’s MSBT
On April 8, Morgan Stanley's spot Bitcoin ETF (MSBT) officially listed on NYSE Arca, becoming the first Bitcoin spot ETF product independently issued by a major U.S. commercial bank. With a fee rate of just 0.14%, it set a new low among mainstream Bitcoin ETFs. This event marks the formal inclusion of Bitcoin into the standardized product system of Wall Street's traditional power core.
MSBT recorded inflows of $34 million on its first day of trading, earning recognition from Bloomberg ETF analysts as one of the top 1% of ETF launches in history. As of April 17, MSBT had achieved net inflows for eight consecutive trading days, accumulating over $133 million in total inflows, with average daily net inflows of approximately $16.6 million. Morgan Stanley has about 16,000 wealth management advisors serving clients with managed assets totaling $9.3 trillion. Bloomberg analysts predict that MSBT’s AUM in its first year will reach $5 billion.
The success of MSBT is the result of multiple structural forces converging. Since Blackrock’s IBIT launched in January 2024, it has attracted over $100 billion in assets under management, proving the real and substantial demand for institutional-grade Bitcoin ETFs and providing market validation for later entrants. Morgan Stanley’s mature wealth management distribution network effectively opened a new channel distinct from Blackrock’s institutional client base. From a regulatory perspective, the SEC’s approval trend allowing bank-affiliated institutions to participate in the Bitcoin ETF market is increasingly clear, significantly raising the likelihood of similar products from Goldman Sachs, Citi, and other major banks.
On-chain data also confirms the acceleration of institutionalization. Large wallet addresses holding more than 10,000 Bitcoin recorded net inflows in early April, marking the second occurrence in 2026. Bitcoin’s funding rates remained flat to slightly negative, confirming that the current price movement is driven by spot demand rather than leveraged speculation, reflecting the typical institution-led market characteristic of "large holders accumulating on dips while retail remains cautious."
However, Ethereum’s situation contrasts sharply with Bitcoin. Ethereum spot ETFs continued to record net outflows in April, with Blackrock’s ETHA experiencing nearly $70 million in weekly outflows during a specific week, while its price oscillated within the $2,100 to $2,400 range. According to CryptoQuant data, over 75% of Ethereum held on Binance is leveraged. This high leverage, combined with ongoing outflows, makes Ethereum more vulnerable to cascading liquidations when market sentiment turns sour. The persistent divergence in institutional capital flows between Bitcoin and Ethereum highlights two fundamentally different asset positioning paths—the former is evolving into "digital gold," while the latter remains in the lengthy process of building "digital asset technological infrastructure."
IV. Bitcoin’s Dual-Driven Pricing: The Overlap of Risk Asset and Scarce Asset Identities
The market movements in April provided a highly valuable stress test for understanding the asset nature of Bitcoin. When the US-Iran negotiations broke down on April 12, Bitcoin fell in tandem with Nasdaq; when the ceasefire news arrived on April 9, Bitcoin rebounded along with the pullback in crude oil. This series of highly correlated price movements once again confirms that Bitcoin, at its current stage, still behaves more like a "risk asset" rather than a maturesafe-haven asset.". However, when viewed on a monthly scale, Bitcoin’s performance showed notable resilience differentiation compared to traditional risk assets.
As of mid-April, Bitcoin's cumulative monthly increase ranged from approximately 3% to 5%, while the Nasdaq Composite Index fell by more than 3% during the same period, and the S&P 500 also performed weakly. Amid this round of geopolitical shocks, gold prices plummeted from a high of $4,800, breaking below $4,780 per ounce. Despite experiencing several significant fluctuations, Bitcoin’s overall level remains higher than at the beginning of the quarter. This contrast indicates that although Bitcoin has yet to become a consensus safe-haven asset among institutional investors, its supply-demand structure has developed a unique bottom support distinct from traditional risk assets due to the deepening institutionalization process via ETFs.
From a technical analysis perspective, Bitcoin exhibited typical characteristics of "range-bound oscillation with directional probing" in April. The range between $62,000 and $75,000 has constituted the core volatility zone for approximately two months, with $62,000 at the lower end being tested twice since February, while $75,000 at the upper end has repeatedly capped upward momentum. In terms of the moving average structure, the death cross between the 50-day and 200-day EMA occurred in November 2025, indicating that the medium-term trend remains within a structural downward channel. However, since April, Bitcoin’s volatility has dropped to its lowest level in two months, and this low-volatility state often signals larger directional movements, prompting investors to prepare for potential shifts in both directions.support level,; while $75,000 at the upper end has repeatedly suppressed upward momentum. In terms of moving average structures, the 50-day and 200-day EMAs formed a death cross in November 2025, indicating that the medium-term trend remains within a structurally downward channel. However, since April, Bitcoin's volatility has dropped to its lowest level in two months, a state of low volatility that often foreshadows larger directional movements. Investors should prepare for potential swings in both directions.
On a broader scale, Iran’s Bitcoin toll policy holds profound structural implications. Requiring payment in cryptocurrency for passage through the Strait of Hormuz effectively embeds Bitcoin into the settlement system of global commodity trade, albeit on a currently limited scale. If this precedent continues, its long-term impact on Bitcoin's evolution from a "speculative asset" to a "settlement tool" may surpass the influence of any single institutional ETF product.
In summary, Bitcoin’s current pricing logic has evolved from being solely macro-driven to a composite pricing system jointly dominated by three factors: "macro liquidity expectations + institutional supply-demand structure + geopolitical risk premium." While short-term prices remain highly sensitive to macro events, the medium-term bottom is continuously being lifted by ongoing institutional accumulation. The halving effect is still slowly releasing, with post-halving supply compression and growing demand via ETF channels forming an "implicit floor" in Bitcoin's macro pricing framework.
V. Outlook: Three-Scenario Analysis and Key Observation Nodes
Considering the three main threads—geopolitics, monetary policy, and institutional capital flows—the current crypto market could evolve along the following three scenario paths.
Scenario One: Ceasefire extended and Fed leadership transition completed, Bitcoin challenges $80,000. If the ceasefire agreement is successfully renewed on April 22, U.S.-Iran negotiations enter a formal framework, and traffic through the Strait of Hormuz gradually recovers to over 50% of pre-war levels; and if Warsh passes Senate confirmation and releases dovish signals, market expectations for the number of rate cuts in 2026 will shift from "0 to 1 time" towards "2 to 3 times," reactivating the narrative of liquidity easing. Under this scenario, Bitcoin could test the psychological threshold of $80,000 in the short term, with JPMorgan even projecting a long-term target range of $170,000 to $240,000 based on Fibonacci extensions. Key indicators for this scenario include: the timing of the ceasefire renewal announcement, Senate voting results on Warsh, and weekly fund flow data for Blackrock IBIT and Morgan Stanley MSBT.
Scenario Two: Ceasefire collapses, tensions escalate again, and Bitcoin retreats to the $65,000 range. If no consensus is reached on extending the ceasefire, Iran announces the resumption of blockades in the Strait of Hormuz, oil prices return to the $110-$120 range, and global inflation expectations surge sharply. The Fed would be forced to signal a stronger commitment to maintaining high interest rates, and market expectations for 2026 rate cuts would be completely priced out. Bitcoin could break below the $70,000 support level, testing the $65,000-$62,000 range, with passive liquidation of highly leveraged positions potentially triggering a short-term liquidity crisis. Key areas to monitor under this scenario include: the number of outbound oil tankers from Dubai Port, global tanker freight rates, and whether U.S. retail gasoline prices breach the psychologically critical level of $4 per gallon.
Scenario Three: Geopolitical easing but persistent stagflation pressures suppress Bitcoin, leading to range-bound trading. If the ceasefire continues but stubborn core inflation delays the Fed’s first rate cut to September or later, liquidity suppression will offset improved risk appetite brought by geopolitical easing. Bitcoin’s most likely trajectory is to maintain wide-range trading between $62,000 and $78,000, with volatility gradually narrowing as the market awaits the next catalyst. For institutional investors with a medium- to long-term focus, this scenario presents a relatively comfortable window for position building: the lower end of the range offers clear entry opportunities, while sustained inflows via ETF channels provide buying support at the upper end.
Beyond these three scenarios, the subsequent evolution of Iran’s Bitcoin toll policy represents a structural variable worthy of separate attention. If other sanctioned countries emulate this policy, it could create unexpected use cases for Bitcoin in real-world global trade settlements, potentially sparking a “Bitcoin settlement demand” trend independent of traditional macro narratives. This latent variable has yet to be fully accounted for in mainstream pricing models and warrants continued monitoring.
VI. Conclusion: At the Intersection of Institutionalization and Geopolitical Dynamics
In April 2026, the cryptocurrency market is standing at a historic crossroads. The successive entry of institutional products such as Morgan Stanley's MSBT marks a profound evolution in the holder structure of Bitcoin, transitioning from "crypto-native" to "global mainstream." This shift provides Bitcoin with unprecedented price floor support and legitimacy endorsement. However, at the same time, the fragility of the US-Iran ceasefire agreement and political pressures undermining the Federal Reserve’s policy independence have created a highly uncertain short-term macro environment, where any single event could trigger significant market volatility.
The key to understanding the cryptocurrency market during this phase lies in distinguishing between "noise" and "signals." The back-and-forth of geopolitical events, the hawkish versus dovish debates among Federal Reserve officials, and large-scale liquidation data on any given day are essentially noise—they affect prices in the short term but do not alter the medium-term trend direction indicated by the structural signal of accelerating institutional adoption. Institutional investors are casting their votes through action: whether or not the ceasefire agreement continues, or whether Powell remains in office, the net inflow data for spot Bitcoin ETFs has shown remarkable stability, indicating that institutions’ long-term allocation logic for Bitcoin does not depend on specific outcomes of any single macro variable.
For investors seeking certainty amidst this complex environment, the most important discipline is to avoid using short-term geopolitical events as the sole basis for position entry or exit decisions. Instead, these should be incorporated into a broader framework that evaluates "institutional capital flows + macro liquidity expectations." The long-term support for Bitcoin near $62,000 is well-supported by fundamental factors, while surpassing $80,000 would require positive catalysts across three dimensions—geopolitics, monetary policy, and institutional participation. Until all three conditions align simultaneously, maintaining patience and position flexibility will remain the core strategy to navigate current volatility. The fog of geopolitics will eventually lift, institutional momentum will continue unabated, and Bitcoin’s historic leap forward is steadily becoming a visible reality.