
Source: Munger Academy
Author: Shi Tou
Why do the vast majority of investors achieve mediocre returns or even suffer significant losses? Stock market investors can be divided into two main groups: those who aim to outperform index returns in the securities market, referred to as “Active Investors A,” and their counterparts, known as “Passive Investors B.”
By definition, the aggregate holdings of Group B closely mirror the composition of the index, automatically earning index-level returns. Consequently, Group A as a whole must also equal the index return.
Chapter 01: The United States in 1963
 In 1963, the U.S. corporate income tax rate was as high as 52%, while the highest marginal personal income tax rate reached 91%.
In January 1963, President John F. Kennedy submitted a tax reduction proposal to Congress, suggesting a decrease in personal income tax rates from 20%-91% to 14%-65%, and a reduction in corporate income tax rates from 52% to 47%. After a single day of decline at the start of 1963, the stock market began to rise and continued to increase until mid-February.
At the end of February 1963, President John F. Kennedy’s remarks unexpectedly shifted from optimism about economic conditions to highlighting potential issues of an economic downturn. This was interpreted by the market as a need for cooling down, causing a sharp decline in the stock market in late February 1963.
In early July 1963, rumors began circulating about an interest rate hike, with speculation that the Federal Reserve might increase the discount rate from 3.0% to 3.5%. As expected, on July 16, 1963, the Federal Reserve announced a rate hike, raising the discount rate from 3.0% to 3.5%. The market started to adjust at the end of October 1963, primarily due to another round of policy tightening.
On November 5, 1963, the Federal Reserve announced an increase in the margin requirement for securities trading from 50% to 70% (which had been lowered from 70% to 50% following the major market crash in 1962). This caused panic in the market, as it was seen as potentially the first step toward a comprehensive tightening of monetary policy.
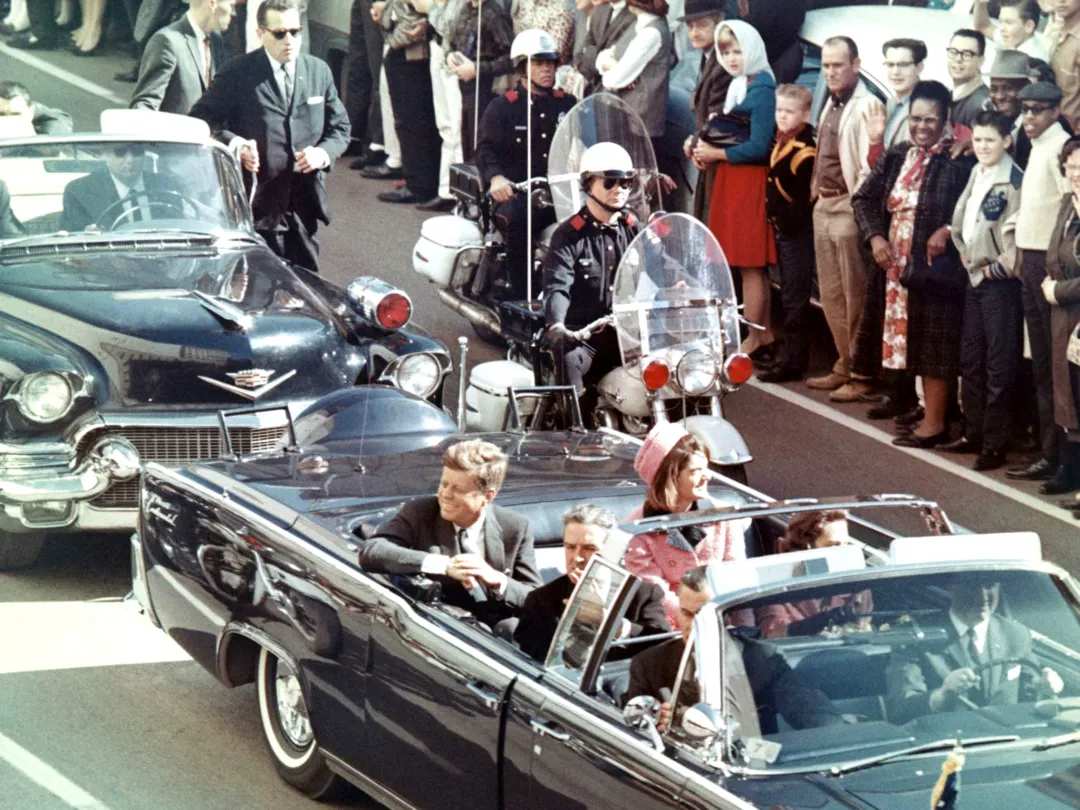
The turning point came on November 22, 1963, when US President John F. Kennedy was assassinated in Dallas, shocking the world. After a sharp decline on November 22, 1963, the stock market quickly rebounded, forming a deep V-shaped trend, and then continued to rise until the end of the year, with the Dow Jones Industrial Average reaching its annual high by year-end.
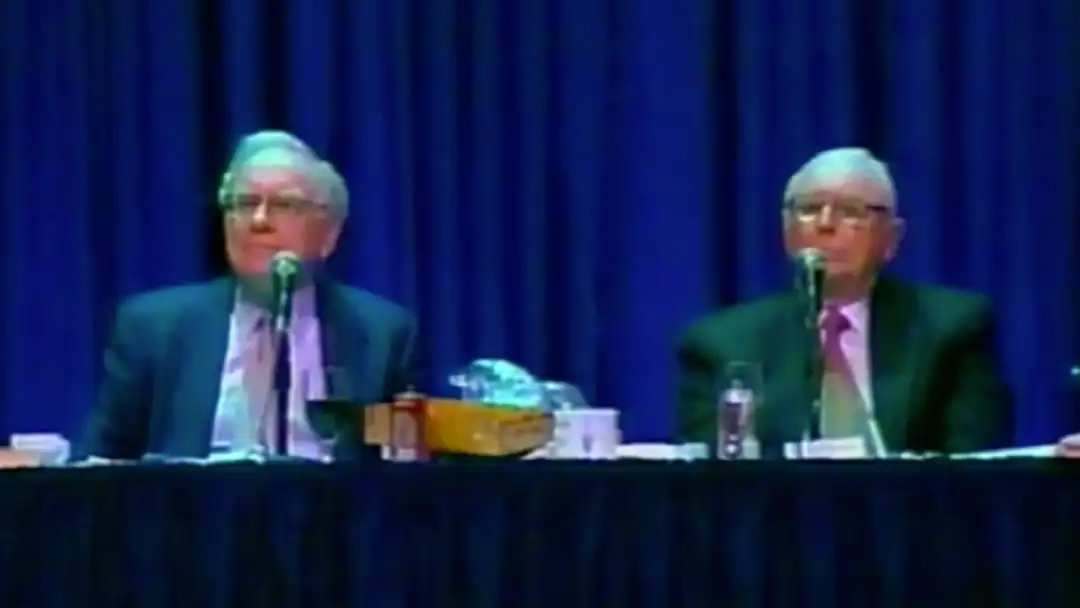
02 Buffett's Investment Style
Based on investment entities, his career can be divided into the Partnership Fund phase and the Berkshire Hathaway phase, demarcated by the dissolution of the partnership fund in 1969.
① Partnership Fund Phase: From 1957 to 1969, spanning 13 years, with an annualized return rate of 29.5%.
② Berkshire Hathaway Phase: From 1965 to 2020, spanning 55 years, with an annualized return rate of 18.9%. The value of Berkshire Hathaway shares increased 27,440 times over 55 years, with shareholders enjoying an annualized return rate of 20.3%.
Based on investment style, his career can be divided into two phases at the acquisition of See's Candies in 1972: the Cigar Butt System phase and the High-Quality Growth Company phase.
① Cigar Butt System: From 1957 to 1971, spanning 15 years, achieving 41 times growth with an annualized return rate of 28.1% (using Berkshire Hathaway data for 1969 due to the fund’s liquidation that year). Representative cases from this phase include Sanborn Map, Dempster Mill, and Berkshire Hathaway.
During this period, returns exceeded 50% in one year (1968 at 58.8%), exceeded 30% in six years, and the lowest return was 10.4% in 1957, with no loss-making years. Over the same period, the S&P 500 index had an annualized return rate of 9.6%.
② High-Quality Growth Company Phase: This phase is divided into two parts at the year 2000: the first half (1972 to the end of 1999) and the second half (2000 to present).
First Half: Spanning 28 years, Berkshire Hathaway's book value grew 654 times, with an annualized growth rate of 26.1%; the company’s stock price increased from $70 per share to $50,600, yielding an annualized return of 26.5% for shareholders. During the same period, the S&P 500 index had an annualized return of 14%.
During this time, there was one year with a return exceeding 50% (1976 at 59.3%), and notably, no years with losses, with the lowest return being 4.7% in 1973. Second Half: Covering 20 years, the annualized return was 10.1%. The highest return during this period was 23% in 2017, while the lowest return was -9.6% in 2008.
In the 55-year investment history of Berkshire Hathaway, the only two years with losses occurred during this phase: -9.6% in 2008 and -6.2% in 2001. Berkshire’s stock price rose from $56,100 per share at the end of 1999 to $339,590 per share by the end of 2019, generating an annualized return of 9.4% for shareholders over 20 years, compared to an annualized return of 6.1% for the S&P 500 index during the same period.
In summary: The masters have demonstrated four replicable paths to successful investing:
①The low-cost index fund model, represented by the Vanguard S&P 500 Index Fund.
②Arbitrage opportunities with certainty, represented by Graham, Buffett, and Thorp.
③The basket of cigar butt stocks model, represented by Schloss.
④The model of growing alongside high-quality companies, represented by Buffett from 1972 to 1999.
03, The Joy of Compounding
At the age of 11, Buffett had already recognized the power of compounding after reading a book titled '1,000 Ways to Make $1,000' in the library.
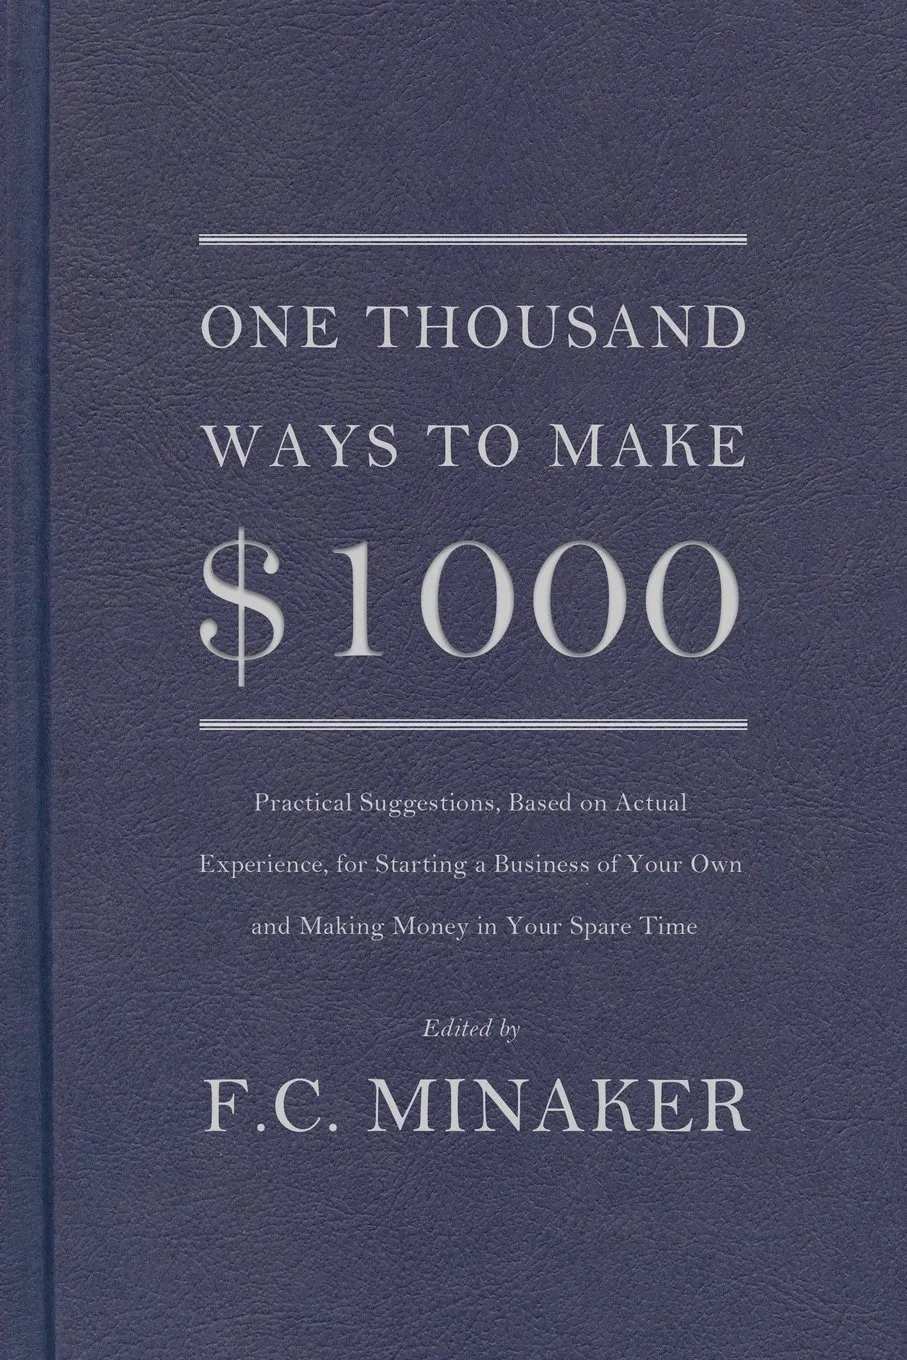
This book made him realize a principle: $1,000 growing at 10% annually will become over $1,600 in 5 years, $2,600 in 10 years, and will exceed $10,800 in 25 years. This was Buffett's first encounter with the concept of compound interest.
The first story: From $30,000 to $2 trillion (1963)
If Queen Isabella of Spain had not spent $30,000 supporting Columbus’s voyage but instead invested in a project yielding an annual compound return of 4%, by 1963 that amount would have grown to $2 trillion.
Buffett said: Without considering the spiritual value brought by the discovery of the New World, it must be admitted that even with the prevalence of colonial exploitation, this event as a whole could not match the value of an IBM.
The second story: From $20,000 to $1 quadrillion (1964)
In 1540, Francis I of France spent 4,000 ecus to purchase Leonardo da Vinci’s famous painting, the Mona Lisa, which was approximately equivalent to $20,000.
If Francis I had been wise enough to find an investment with an after-tax return of 6%, then today that sum would be worth $1 quadrillion, 3,000 times the current U.S. national debt.
Buffett said: The lessons we can learn from this are, first, live long, and second, small differences in compound returns ultimately make a big difference in the final figures.
The third story: From $24 to $42 billion (1965)
The Native Americans sold Manhattan Island to the Dutch for $24. Calculated based on the price of land sales, it is now approximately $12.5 billion, which sounds like a large number.
However, if the Native Americans could find an annualized return of 6.5%, the $24 would have compounded to $42 billion over 338 years until today.
Moreover, by striving for an additional 0.5% annually, achieving a 7% yearly return, that $24 from 338 years ago would now be worth $205 billion.
The following three factors are beneficial to capital growth:
① Longevity.
② High compound growth rates.
③ A combination of both of the above (highly recommended by the author).
After understanding compound interest, one realizes that 'the first rule of investing is not to lose money, and the second rule is to remember the first rule' makes perfect sense.
Seth Klarman stated: Reasonable and sustainable returns > impressive but inconsistent returns.
In other words, for an investor, obtaining consistently good returns under limited risk may be better than achieving unstable and sometimes 'spectacular' returns under relatively higher risk.
For example, an investor who maintained an annual return of 16% over the past decade might end up earning more than an investor who earned 20% annually for nine years but lost 15% in the final year.
Buffett once said: The $10 spent on a haircut actually costs $300,000.
If in 1956 Buffett had not spent $10 on a haircut but instead invested it in his partner's company, then today that $10 could have become $1 million (calculated at a 22% annual return over 58 years).
Through the lens of compound interest thinking, we can understand why he lives so frugally, as getting a haircut really is expensive.
04. Index Funds
In the 1993 letter to shareholders, Buffett first discussed index funds, writing:
By regularly investing in an index fund, a completely unknowledgeable amateur investor can often outperform most professional investors. Oddly enough, when dumb money knows its limitations, it ceases to be dumb money. However, if you are an investor with basic common sense and understanding of business, you should be able to identify 5 to 10 companies with reasonable stock prices and long-term competitive advantages.
At this point, diversification theory becomes meaningless for you, potentially harming your investment results and increasing your risk. I cannot comprehend why an investor would allocate capital to their 20th-most familiar company rather than concentrate on their top few choices that they know best and offer the highest value for money.
For individual investments, I can offer one piece of advice for your reference: Most investors, including both institutional and individual investors, will eventually realize that the best way to invest in stocks is to purchase low-cost index funds.
In the 2003 letter to shareholders, Buffett continued to discuss index funds, saying:
Those index funds with very low fees (such as those offered by Vanguard Group) are ideally designed for investors. In my view, for most people looking to invest in stocks, subscribing to low-cost index funds is the most ideal choice.
The 2004 letter to shareholders continues in this style:
Over the past 35 years, American businesses have generated exceptionally strong performance. In theory, equity investors should also have reaped substantial returns by simply riding the wave and holding low-cost index funds to achieve such results.
Why do the vast majority of investors achieve mediocre returns or even suffer significant losses?
Equity investors can be divided into two major groups: those aiming to outperform the index returns in the securities market, referred to as 'Active Investors A'; and the other group, 'Passive Investors B,' who stand in contrast.
By definition, the aggregate holdings of Group B closely mirror the composition of the index, automatically achieving index-like returns. Therefore, Group A as a whole must also equal the index return.
However, active investors bear significant annual fees, substantial performance-based compensation, and transaction costs including commissions and taxes from frequent trading.
After deducting these costs, the returns of Group A will inevitably fall below those of Group B, as Group B has minimal requirements for the credentials or intellectual capacity of fund managers, paying only nominal management fees and negligible transaction costs (incurred when changes occur in index constituents).
Editor /rice