
West Securities reviewed eight major financial crises over the past century and distilled a framework categorizing crises into three types—excess physical assets, excess domestic currency, and excess debt—and a six-stage evolution model. The report warns that global markets currently face a rare confluence of three risks: an AI bubble, sovereign debt vulnerabilities, and erosion of monetary credibility. However, true crises typically emerge only after interest rate hiking cycles conclude. Against this backdrop, the report recommends shifting from an exclusive bet on AI to a 'barbell' portfolio allocation combining AI exposure with inflation-hedging assets to navigate potential market volatility.
Last week’s "Black Friday" sell-off in U.S. equities triggered widespread market concerns about an AI bubble and potential financial crisis, but historical experience suggests that genuine crises usually erupt only after interest rate hikes end.
A recent research report by West Securities systematically analyzed eight representative global financial crises over the past century, formulating an analytical framework based on "three types of excesses" and "six stages," and cautioning that global risk assets may now be facing a rare simultaneous buildup of physical asset excess, domestic currency excess, and debt excess.
 According to West Securities’ strategy report, U.S. equity markets experienced a "Black Friday" on June 5, as stronger-than-expected nonfarm payroll data sharply intensified market expectations for further rate hikes. Both equities and bonds underwent significant corrections, while gold temporarily lost its safe-haven status—moving in tandem with equity indices—a classic sign of liquidity stress. The report notes that valuations and volatility levels for certain global assets are currently at historically elevated percentiles, signaling early signs of bubble risk.
However, the report also emphasizes that the Federal Reserve remains in a rate-cutting cycle, and CME Group’s Fed Funds futures market consensus indicates that any rate hike would not occur before December at the earliest. Thus, the probability of a financial crisis in the near term remains low. This correction appears more like a 'dress rehearsal' ahead of a final bubble burst. Nevertheless, the complexity arising from the convergence of three distinct risks implies that historical analogies may not apply straightforwardly, warranting vigilance against the possibility that 'this time is different.'
Eight Crises Over a Century: Three Types of Excess, Six Stages
The West Securities report selected eight representative financial crises from the past century as case studies and identified their underlying logic: the most immediate trigger of a crisis typically stems from oversupply in financial products, while the bursting of bubbles usually requires liquidity tightening as a catalyst.
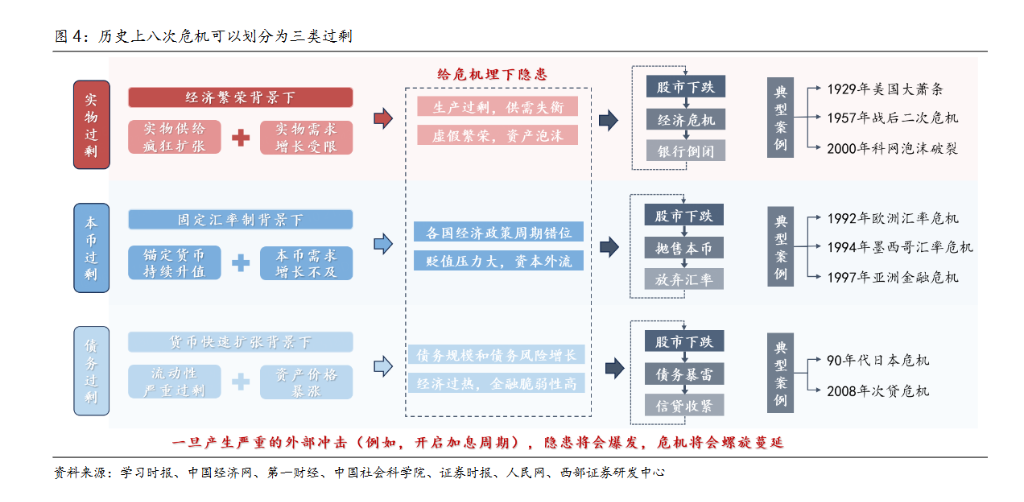
The report classifies the eight crises into three types of excess:
First, excess physical assets, including the 1929 U.S. Great Depression, the postwar second crisis (1957–1958), and the 2000 dot-com bubble;
Second, excess domestic currency, including the 1992 European Exchange Rate Mechanism crisis, the 1994 Mexican peso crisis, and the 1997 Asian financial crisis;
Third is debt overhang, including Japan's economic crisis in the 1990s and the 2008 subprime mortgage crisis.
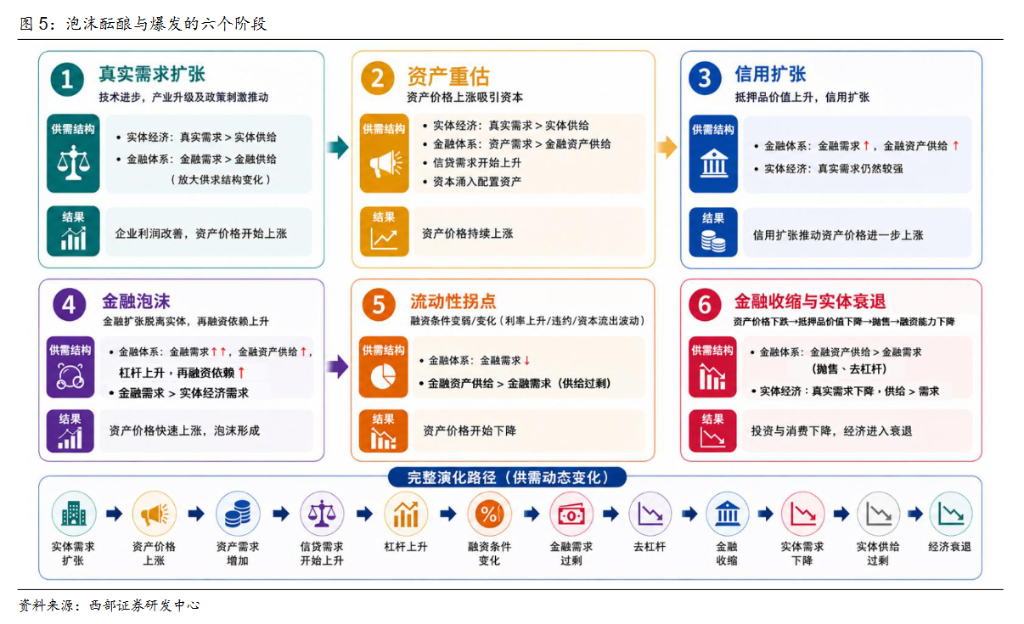
In terms of its underlying dynamics, the report summarizes the bubble cycle—from formation to collapse—into six stages. The core logic is that the pace of financial product supply outstrips real demand; once a liquidity turning point occurs, the resulting oversupply accelerates and ultimately triggers a crisis.
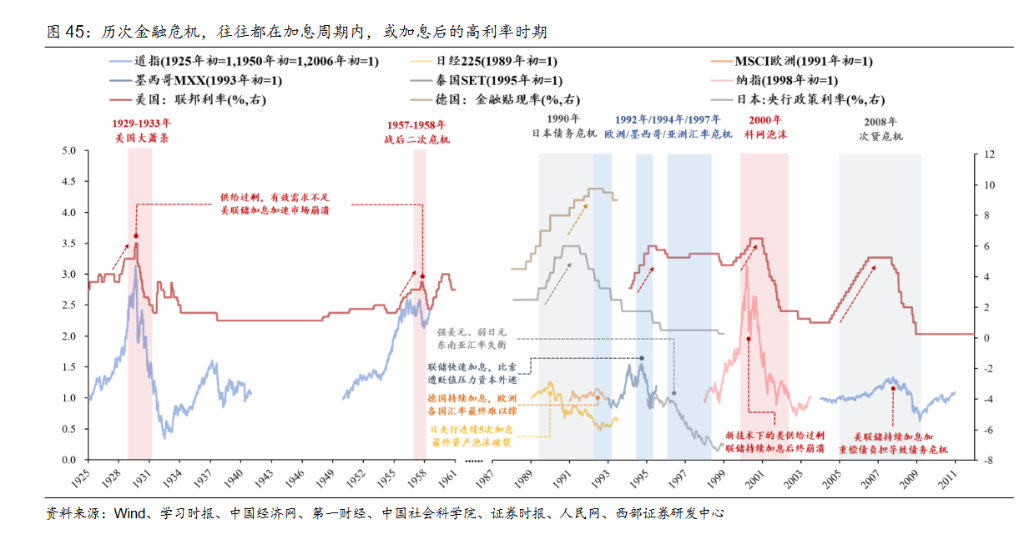
Nearly all past crises have occurred either during interest rate hiking cycles or in the high-interest-rate environment following such hikes. Rate hikes serve as the critical catalyst for crisis onset.
Physical Overcapacity: Transmission Mechanism from the Great Depression to the Dot-com Bubble
The report classifies the Great Depression, the second postwar crisis, and the dot-com bubble as crises driven by physical overcapacity. All three share a highly similar transmission mechanism: a vicious cycle of stock market crashes → economic downturn → bank failures.
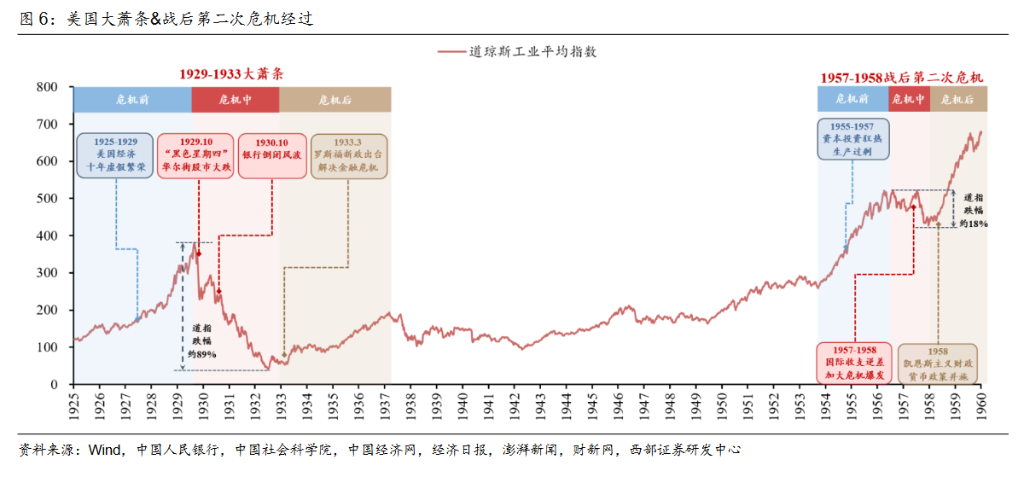
Prior to the outbreak of the Great Depression (1929–1933), the U.S. industrial production index rose rapidly, with supply-side growth far exceeding demand growth. This was compounded by extreme wealth inequality, which suppressed household purchasing power, while rampant speculation fueled irrational stock price surges.
Following the stock market crash on 'Black Thursday,' credit conditions tightened sharply, liquidity nearly dried up, businesses collapsed en masse, and unemployment soared.
The second postwar crisis (1957–1958) similarly stemmed from corporate overexpansion, which led to a sharp surge in capacity, while demand growth failed to keep pace. Subsequent monetary tightening by the Federal Reserve accelerated the crisis.
The dot-com bubble (1998–2001) exhibited characteristics akin to supply overhang: after internet penetration peaked, user growth slowed markedly, causing effective demand to drop significantly. Yet venture capital investment in the sector surged in 1999, leading to massive capital inflows and severe supply-demand imbalances.
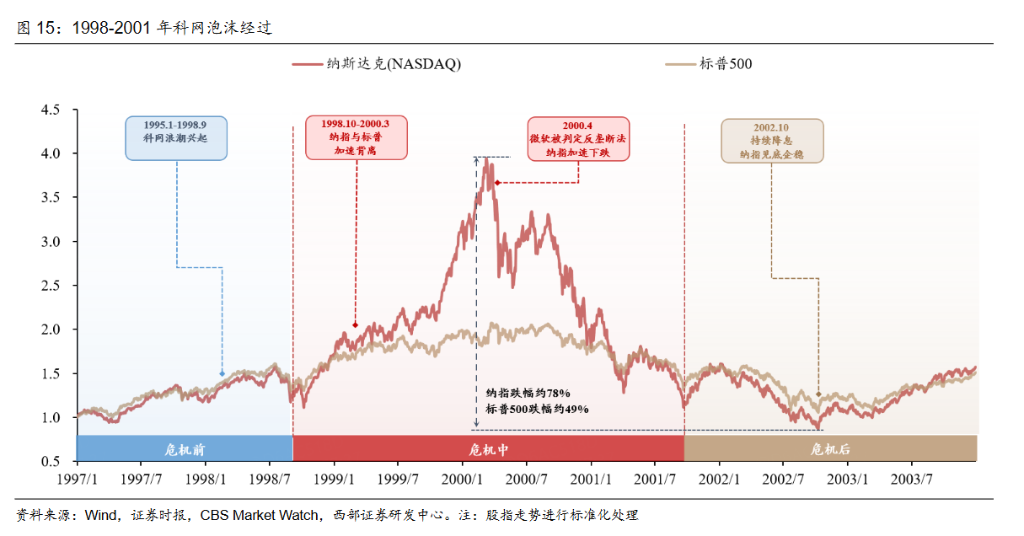
The report notes that even after the Federal Reserve began cutting interest rates following the dot-com bubble burst, the Nasdaq Index continued to decline. Once market confidence was damaged, monetary policy adjustments alone proved insufficient to immediately reverse the downturn.
In terms of asset performance, equity assets broadly declined during the physical surplus crisis, while safe-haven assets initially held up relatively well; toward the end of the crisis, safe-haven and economically sensitive recovery-linked assets led the rebound.
Domestic Currency Surplus: Systemic Challenges of Fixed Exchange Rate Regimes
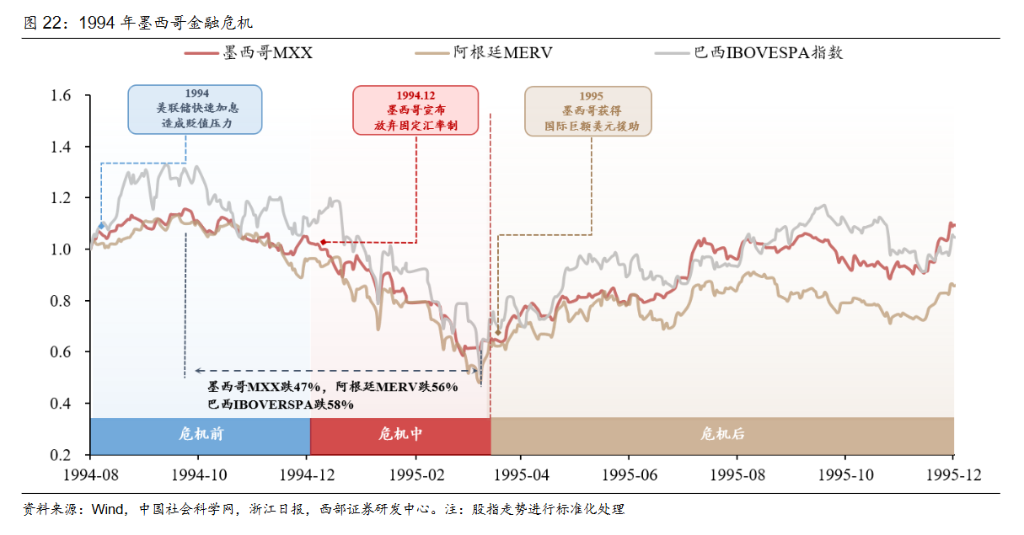
The report classifies the 1992 European Exchange Rate Mechanism (ERM) crisis, the 1994 Mexican financial crisis, and the 1997 Asian financial crisis as domestic currency surplus crises. Their common transmission mechanism was: domestic economic shock → declining attractiveness of the domestic currency due to a fixed exchange rate → massive capital flight → central bank abandonment of the fixed exchange rate → an intensifying vicious cycle of crisis.
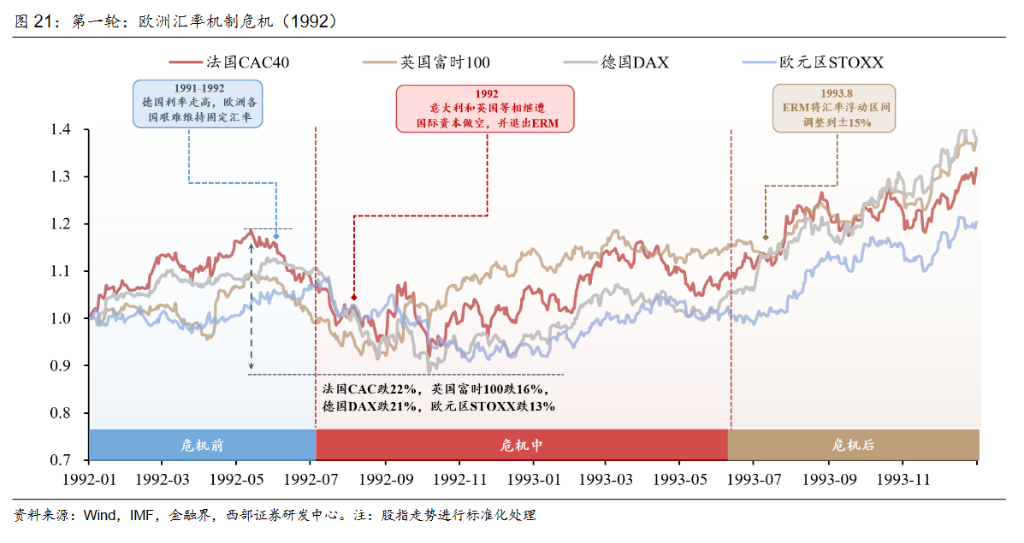
During the ERM crisis, the United Kingdom implemented monetary easing to counter an economic recession, which created a policy mismatch with the Bundesbank’s continued interest rate hikes in Germany, providing George Soros with an opportunity to short the British pound.
After the pound abandoned its peg, it depreciated by 29% between September 1992 and February 1993. In the Mexican crisis, the U.S. Federal Reserve raised interest rates seven times consecutively starting in April 1994, totaling 300 basis points, triggering massive capital outflows; the peso depreciated by 48% from December 1994 to March 1995. During the Asian financial crisis, a strengthening U.S. dollar combined with a sharp depreciation of the Japanese yen suppressed Southeast Asian exports; between July 1997 and February 1998, the Indonesian rupiah depreciated by 11%, the Thai baht by 59%, and the Malaysian ringgit by 47%.
In terms of asset performance, equity assets in the affected countries broadly declined during these three currency crises, while precious metals performed strongly, and export-linked commodities demonstrated relative resilience.
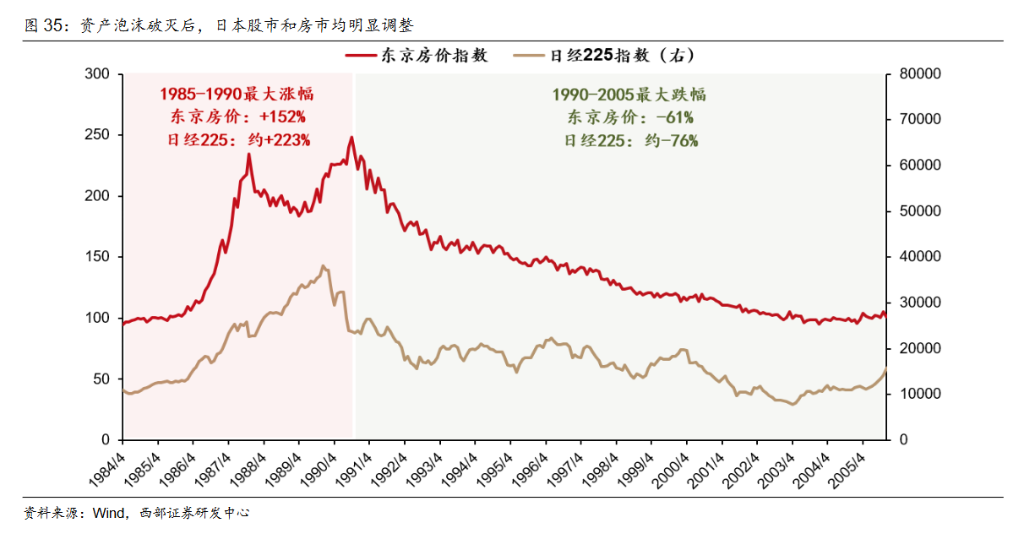
Debt Overhang: Japan’s 'Lost Two Decades' and the Subprime Mortgage Crisis
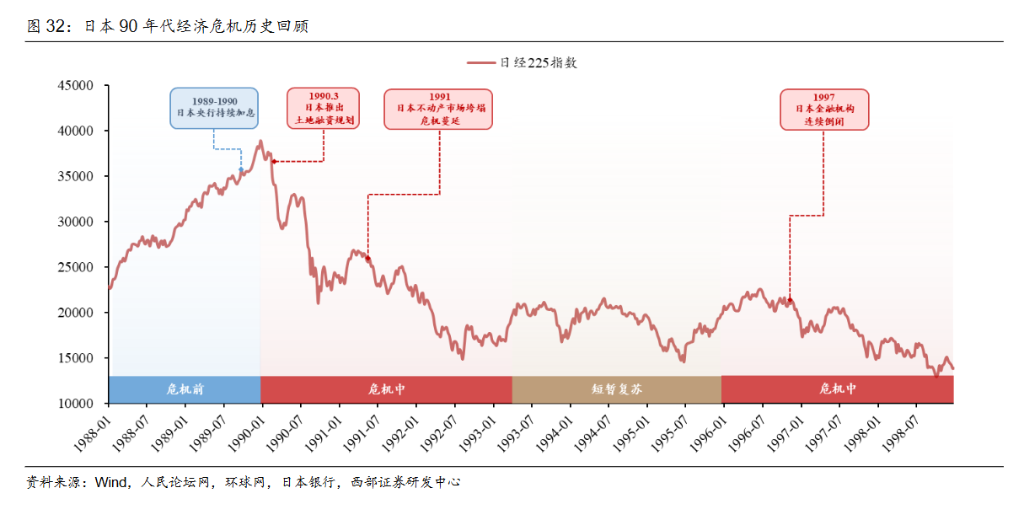
The report categorizes Japan’s economic crisis in the 1990s and the 2008 subprime mortgage crisis as debt surplus crises, with the following transmission mechanism: rapid monetary expansion → severe liquidity surplus → substantial credit and debt expansion → policy tightening → surging debt burdens → bank credit contraction → economic crisis.
In Japan’s crisis, the yen appreciated sharply following the Plaza Accord, driving large inflows of capital into equities and real estate. To alleviate the pressure from yen appreciation, the Bank of Japan injected excessive fiscal and monetary stimulus. Between 1989 and 1991, the Bank of Japan raised interest rates five times, causing the asset bubble to burst abruptly. The Nikkei 225 Index plummeted, property prices collapsed, corporate bankruptcies surged, and Japan subsequently entered its 'Lost Two Decades,' with GDP growth slowing dramatically after 1991 and even turning negative in some years.
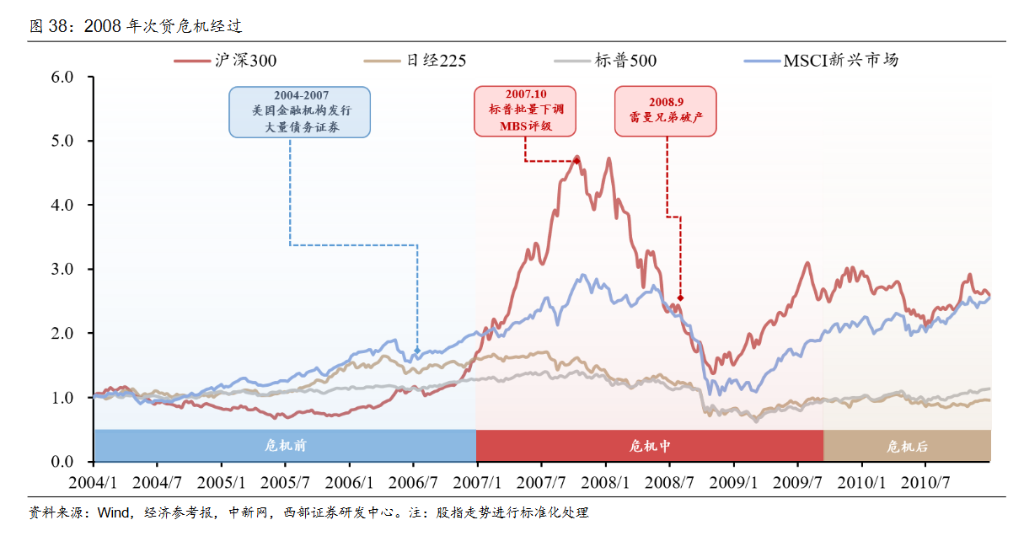
In the subprime mortgage crisis, a low-interest-rate environment fueled the large-scale expansion of subprime lending, and soaring home prices spurred the rise of asset securitization, widely dispersing credit risk across markets. After the Federal Reserve tightened policy, housing prices peaked in July 2006 and began to decline, leading to downgrades of subprime mortgage-backed securities. In September 2008, Lehman Brothers collapsed, prompting financial institutions to scramble for cash and risk-free assets, nearly freezing market liquidity. During the crisis, precious metals exhibited strong defensive characteristics, while real estate and equity markets—most directly tied to debt—suffered the steepest declines.
Current Risks: Triple Excess Overlap—Beware of 'This Time Is Different'
The report notes that global risk assets currently face a rare confluence of three types of crises: AI bubble risks (excess physical capacity), sovereign debt distress (excess debt), and widening cracks in sovereign currency credibility (excess domestic currency).
Regarding the AI bubble, the report suggests the issue remains largely microeconomic, primarily manifesting as excessively rapid price appreciation. Since April, U.S. AI-related equities have risen faster than earnings-per-share (EPS) revisions. Following Broadcom’s weaker-than-expected earnings guidance, its share price has already begun adjusting toward more reasonable expectations. The Nasdaq’s forward P/E ratio remains near its historical median, and its PEG ratio is at a historically low level, indicating it has not yet reached bubble territory.
Macro-level risks are more complex. On one hand, historical experience shows asset bubbles typically burst after interest rate hikes, yet current conditions do not yet warrant a rate hike. On the other hand, the credibility of the U.S. dollar itself is being challenged in this cycle—a rare variable historically—which makes the sources of risk more diverse.
The report specifically highlights that U.S. Treasury market volatility is highly correlated with global developments. Emerging markets, along with Japan and South Korea, face significant currency depreciation pressures. The situation between the U.S. and Iran remains unclear, and the impact of oil prices on U.S. Treasury yields is uncertain. Thus, the risk of significant market adjustments even before a rate hike cannot be entirely ruled out.
Rebalancing the 'AI + Price-Increase' Barbell Strategy
In light of these complex risks, the report recommends investors moderately rebalance toward traditional sectors and construct a bullish 'AI + price-increase' barbell portfolio.
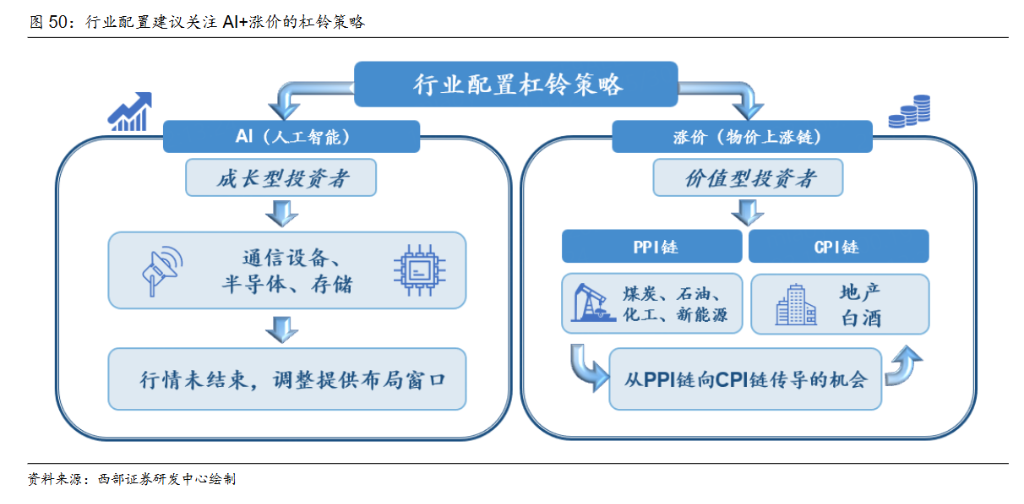
The report argues that if a liquidity shock in U.S. equities during Q3 forces the Federal Reserve into quantitative easing (QE), it would create favorable conditions for China’s domestic debt resolution. This could lead to a repair of Chinese non-financial sector balance sheets and enable producer price index (PPI) increases to transmit through to the consumer price index (CPI) chain.
Specifically: First, the AI sector has not yet entered bubble territory, but growth investors must accept the high volatility of AI computing hardware (including communications equipment, semiconductors, and memory). Second, value investors should both capitalize on the PPI-driven pricing chain (coal, oil, chemicals, and new energy) and patiently await the second half of the year when balance sheet repairs could drive CPI-linked opportunities (real estate, baijiu, etc.).
The report also cautions that gold’s unexpected sharp decline since January serves as a telling example—even though fundamental bullish drivers such as de-dollarization and central bank buying have not fundamentally changed (China’s central bank even added nearly 10 tonnes of gold reserves in May), gold prices remain subdued, underscoring the market’s volatility and uncertainty.
Editor/Deng