Shenwan Hongyuan believes that gold's implied volatility has already retreated to a low level, quietly reopening the window for allocation. Expectations of a U.S.-Iran ceasefire have cooled oil prices, and the triple pressures on gold—stemming from policy, capital flows, and central bank gold sales—are gradually easing. Model projections suggest a 2026 gold price midpoint of USD 4,767 per ounce, with an optimistic scenario pointing to USD 5,416.
As U.S.-Iran ceasefire negotiations enter their final stage, the core rationale that previously suppressed gold prices is reversing, and the window for gold allocation may have quietly opened.
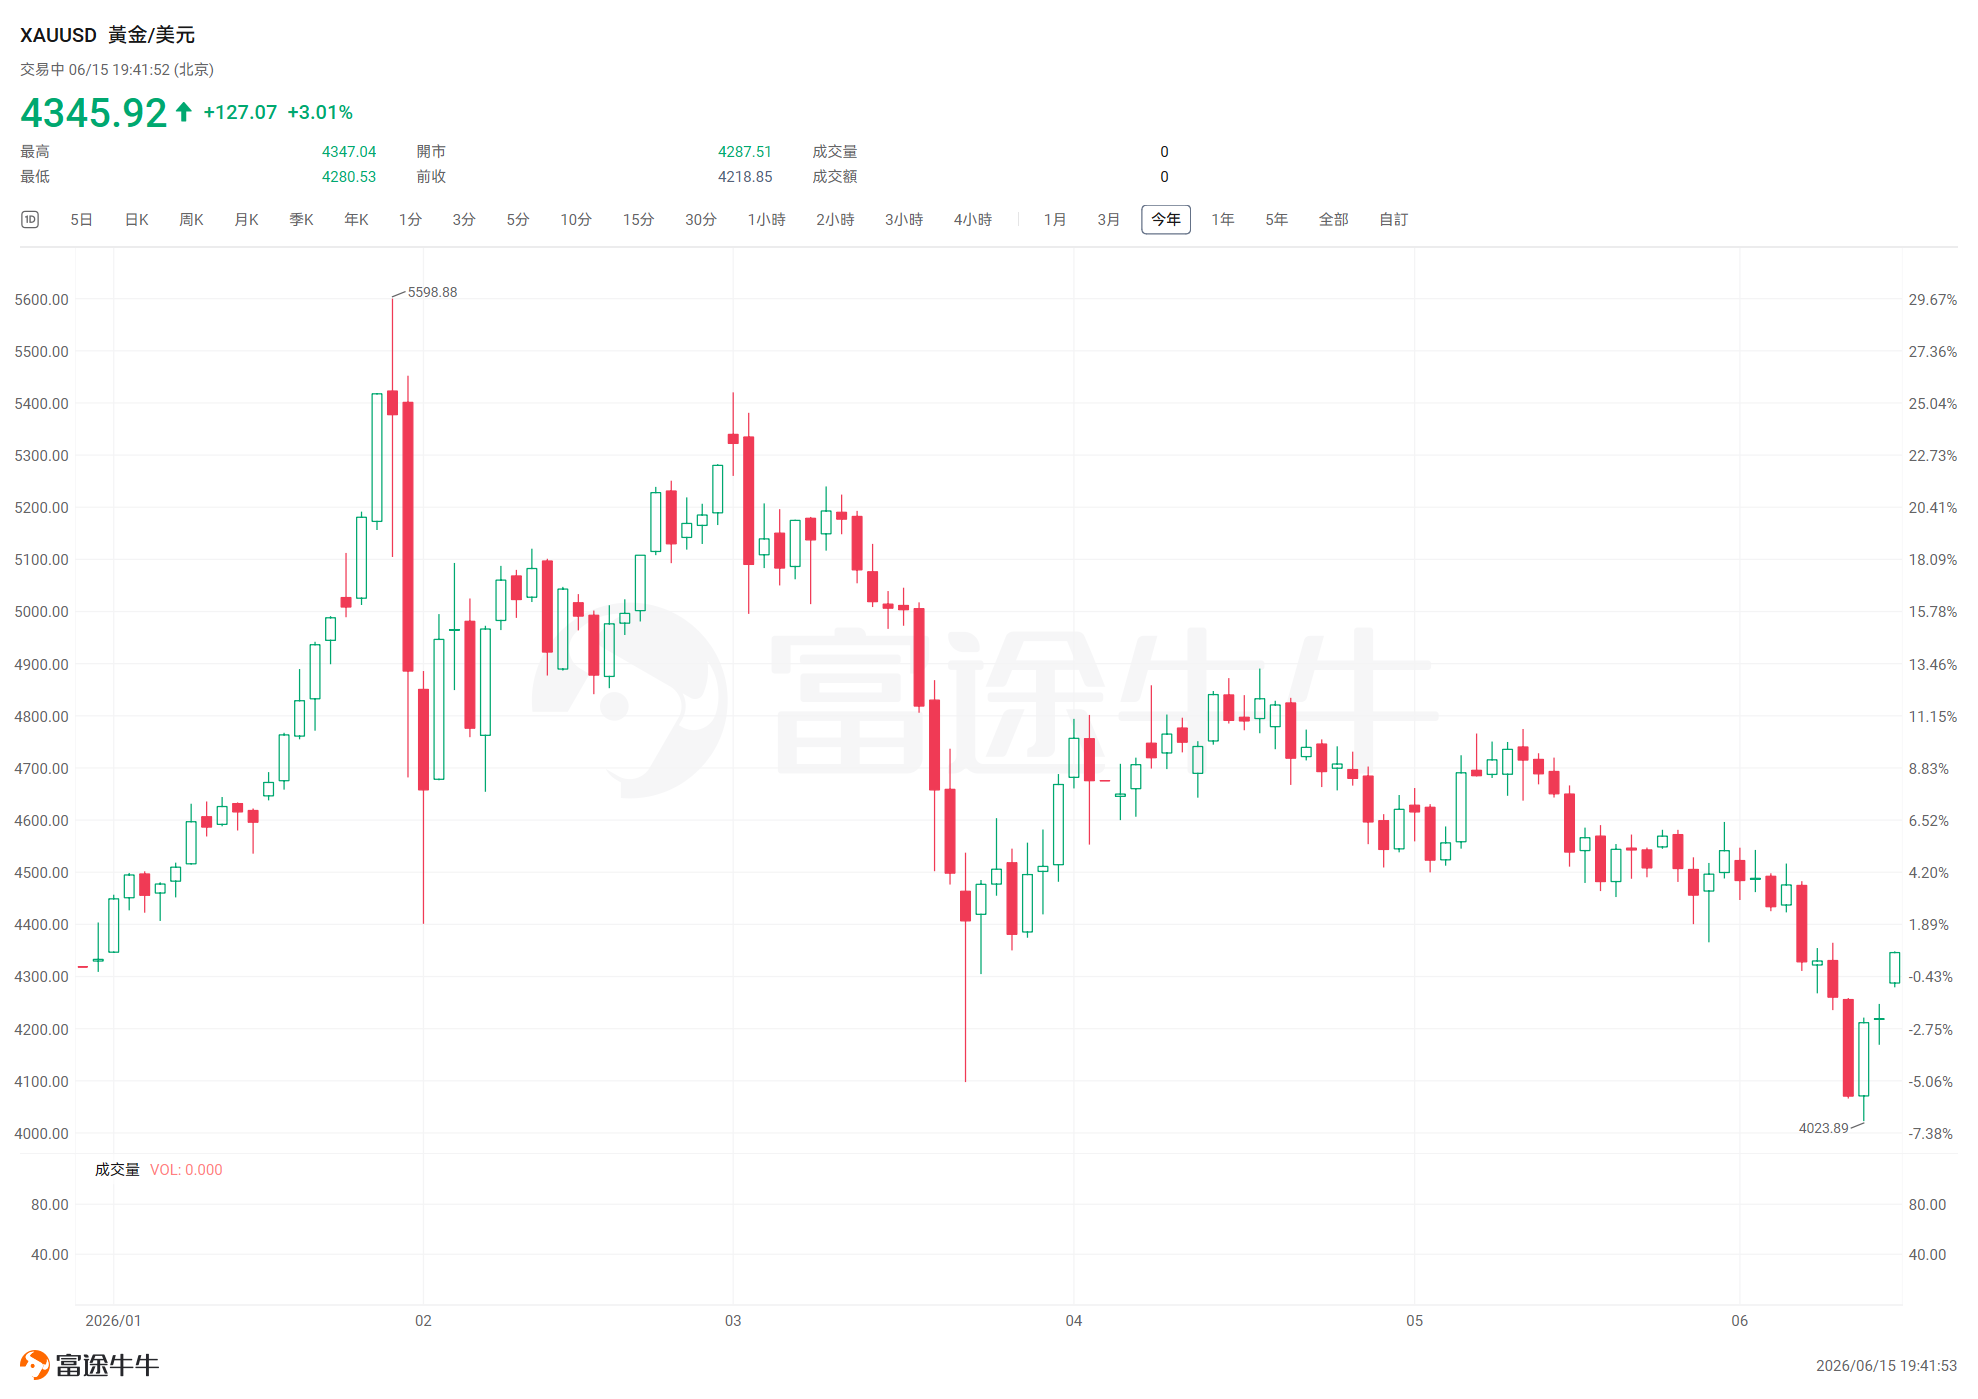
On the 14th, the United States and Iran announced a memorandum of understanding (MoU) on a ceasefire. U.S. President Trump stated on social media that the Strait of Hormuz would reopen following the signing of the MoU on the 19th. Boosted by this news, oil prices plunged by 5% on Monday, while spot gold rebounded sharply by 3%.
 In a report released on June 15, Shenwan Hongyuan Securities Research Institute noted that gold’s implied volatility has fallen to a historical low, indicating that gold currently offers strong allocation value.
According to the firm’s quantitative model, if central banks and ETFs maintain their current pace of gold purchases through 2026, the average gold price for the year could reach USD 4,767 per ounce; in an optimistic scenario, it could touch USD 5,416 per ounce; even under conservative assumptions, support remains robust near USD 4,250 per ounce.
Threefold pressures converge, driving gold prices down three steps this year
After hitting a record high of USD 5,626.8 per ounce in January 2026, gold entered a prolonged correction, experiencing three sequential step-down declines this year. As of last Thursday, prices had fallen more than 20% from their March peak, entering a technical bear market for the first time in four years.
Shenwan Hongyuan Research attributes this round of decline to the confluence of three distinct pressures.
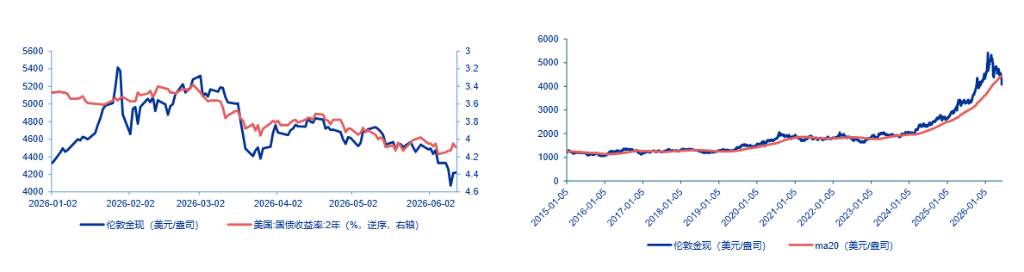
The first pressure stems from a sudden reversal in Federal Reserve monetary policy expectations.
Following the outbreak of the U.S.-Iran conflict, oil prices surged significantly, compounded by stronger-than-expected U.S. nonfarm payroll data for May. Market expectations for the Federal Reserve shifted rapidly from 'rate cuts within the year' to 'rate hike pricing,' with CME interest rate futures indicating a substantially higher probability of a December rate hike. This raised the holding cost of gold, exerting direct downward pressure on its price. The market currently expects the Fed to implement one rate hike in December 2026.
The second pressure arises from technical feedback loops.
After gold prices broke below the 200-day moving average (approximately USD 4,300), systematic funds and momentum traders triggered quantitative stop-losses, reduced positions under trend-following strategies, and unwound leveraged positions, creating a 'long squeeze' that formed a negative feedback loop and accelerated the decline in gold prices.
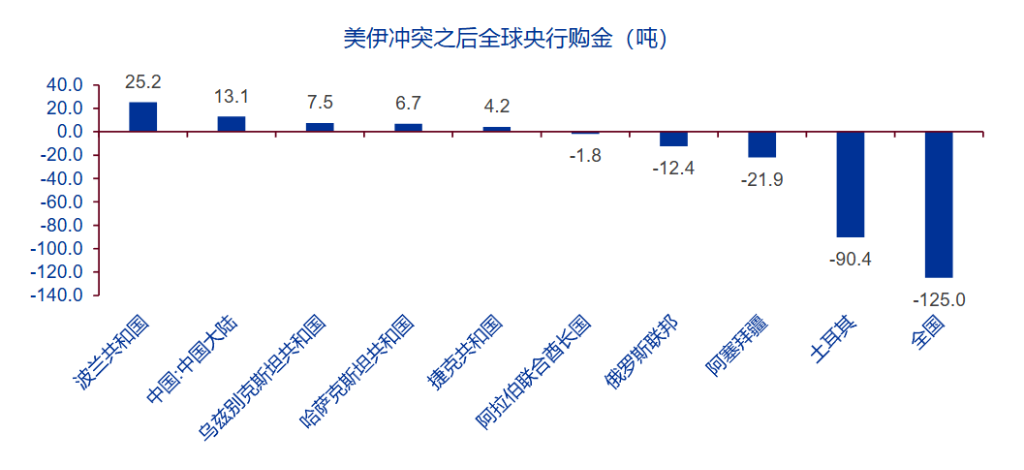
The third source of pressure stems from disruption to the central bank gold-buying rationale.
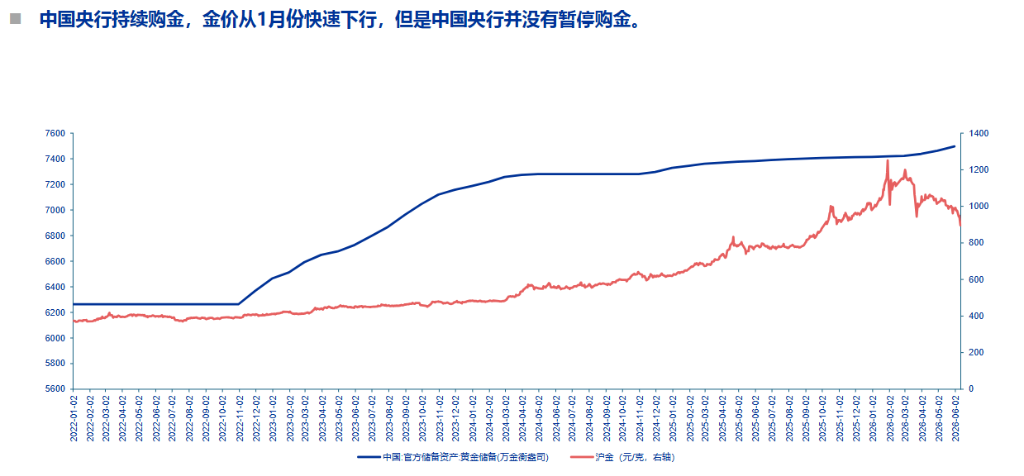
Following a sharp rise in oil prices, energy-import-dependent countries such as Turkey, India, and Russia were forced to sell gold reserves to maintain foreign exchange reserves. Consequently, global central banks shifted from net buyers to net sellers of gold, presenting a temporary challenge to the gold-buying rationale. Notably, the People’s Bank of China did not suspend its purchases during this period and continued its steady accumulation of gold reserves.
With the sources of pressure dissipating, allocation windows are gradually reopening.
Shenwan Hongyuan Research notes that the core driver behind all three aforementioned pressures was the surge in oil prices triggered by U.S.–Iran tensions; thus, the alleviation of downward pressure on gold prices also hinges on this factor.
As U.S.–Iran negotiations progress, oil prices have already retreated significantly from their recent highs.
The backwardation structure in crude oil futures has narrowed substantially, with the premium of near-month contracts over deferred-month contracts falling from historical highs back to levels seen in early March, indicating a marked easing of short-term supply tightness concerns. Two key developments warrant close attention going forward: first, whether the Strait of Hormuz will be fully reopened following a potential agreement; and second, whether oil prices can achieve a systemic downward shift in their pricing anchor amid currently low inventory levels.
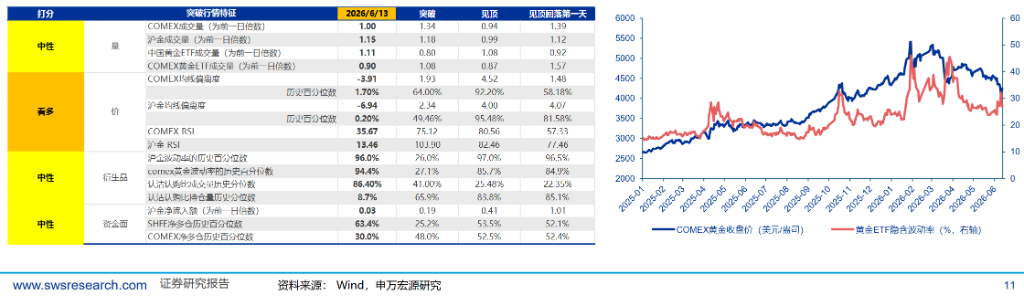
From a quantitative perspective, technical indicators in the gold market have improved markedly. The RSI for COMEX gold has declined to 35.67, and the deviation from its moving average now sits at the 1.7th percentile historically—a very low level. For Shanghai Gold Futures (Au), the moving average deviation is even lower, reaching the 0.2nd percentile, both signaling an oversold condition.
Implied volatility in gold ETFs has also fallen to low levels, while the put-to-call volume ratio has risen to the 86.4th percentile historically, indicating that bearish sentiment in the market has been largely exhausted.
Outflows from gold ETFs remain a headwind, though the extent of further downside appears measurable.
Although gold’s allocation value has become evident, Shenwan Hongyuan Research simultaneously cautions that the continued outflows from gold ETFs remain a non-negligible potential source of downward pressure.
Referencing the period between 2019 and 2020 when the Federal Reserve paused interest rate cuts, SPDR Gold Trust holdings declined from a peak of 1,279 tonnes to a low of 974 tonnes—a reduction of 305 tonnes, or 24%. Currently, SPDR Gold Trust holdings have already declined by 81 tonnes (approximately 7%) from their recent peak, indicating that the outflow process is not yet complete.
Based on this, the firm calculated worst-case gold price scenarios under two assumptions:
If the absolute tonnage reduction from the previous cycle (305 tonnes) is applied, there remains approximately 224 tonnes of potential outflows, implying a worst-case gold price of around USD 3,892 per ounce;
If the percentage decline (24%) is applied, there remains approximately 100 tonnes of potential outflows, implying a worst-case gold price of around USD 4,250 per ounce.
The latter scenario aligns closely with the support level derived from the quantitative model under conservative assumptions, suggesting that the USD 4,250 level may represent a relatively strong price floor zone.
Quantitative model anchors the central reference point; multi-scenario analysis provides guidance
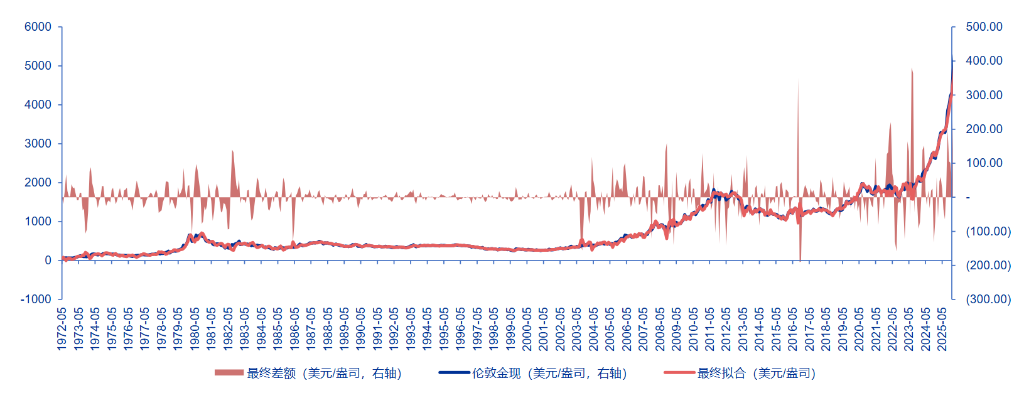
Shenwan Hongyuan Research has incorporated global gold ETF holdings as a new variable into its existing quantitative framework, significantly enhancing the model’s explanatory power for gold prices.
Key drivers of gold pricing in the current phase (since 2022) include: global central bank gold reserves, the U.S. fiscal deficit ratio, U.S. economic policy uncertainty, the real yield on 10-year U.S. Treasuries, and changes in global gold ETF holdings.
Based on this framework, the report presents three scenario-based forecasts:
Under the base scenario—in which central banks and ETFs maintain their current pace of gold purchases—the average gold price in 2026 is projected to be approximately USD 4,767 per ounce;
Under the optimistic scenario—in which both central bank and ETF gold buying accelerate—gold prices could reach USD 5,416 per ounce;
Under the cautious scenario—in which central bank gold purchases turn negative and ETFs experience net outflows—gold prices would still find strong support near USD 4,250 per ounce.
The institution also cautions that the above projections are subject to multiple risks: short-term asset price fluctuations may not reflect long-term trends; a deep recession in the U.S. or Europe could amplify market panic and exacerbate asset price volatility; and significant shifts in U.S. policy direction during a Trump administration could also disrupt these forecasts.
Want to select stocks or get a stock diagnosis? Curious about the opportunities and risks in your portfolio? For all your investment questions,Just ask Futubull AI!