
Veteran market strategist Jim Paulsen has issued a warning that the 'policy stress index'—comprising high oil prices, elevated interest rates, and a strong U.S. dollar—has approached levels last seen during the peak of last year’s trade shock. His research indicates that this indicator leads economic data by approximately three months, suggesting that the U.S. economy and equity markets could face downside risks this summer through fall that are currently underestimated by the market.
While Wall Street analysts rush to raise their S&P 500 price targets to 8,000 or even 8,500, a market veteran with four decades of experience has issued a starkly contrasting warning: the market is overlooking a storm of policy pressures that has been building for months, and its full impact has only just begun to transmit through the system.
According to a model developed by investment veteran Jim Paulsen, persistently elevated crude oil prices, volatility in bond markets, and movements in the U.S. dollar will significantly weigh on U.S. economic momentum over the coming months and could continue to suppress economic activity through the autumn.
 His core assessment is that the policy pressure index exhibits a roughly three-month lagged correlation with Citi’s Economic Surprise Index, and the current policy pressure index has approached its highest level since the market turbulence triggered by Trump’s trade war in the spring of 2025.
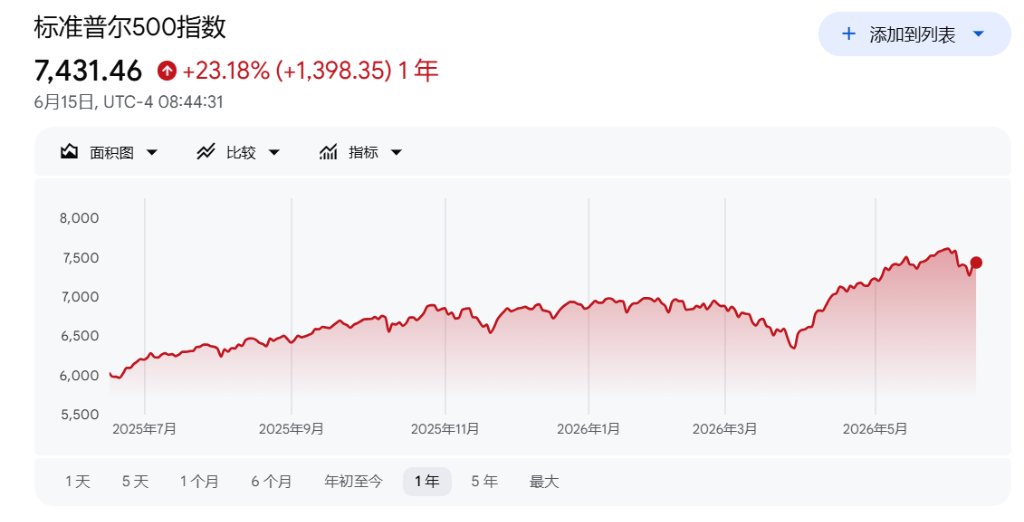
This warning comes against a backdrop in which the S&P 500 has added approximately $9 trillion in market capitalization since the end of March, repeatedly hitting record highs since mid-April.
However, stronger-than-expected data on June 5non-farm payroll datafueled market expectations of an interest rate hike within the year, dampening risk appetite. Meanwhile, trading desks at Barclays and Goldman Sachs issued similar warnings last week, noting that crowded positions, narrow market breadth, and the prospect of 'higher rates for longer' expose equities to the risk of a sharp correction.
Policy Pressure Index Nears Danger Zone
At the heart of Paulsen’s analytical framework is a 'Policy Pressure Index,' which holistically measures the combined impact of high oil prices, the 10-year U.S. Treasury yield, and the U.S. dollar. The index has now neared its highest level since the spring of 2025—the period when Trump’s trade war caused severe market turbulence.
The key lies in the lag effect. Paulsen has found a strong negative correlation—reaching a coefficient of 0.7 (on a scale of 1)—between the Policy Pressure Index and Citi’s Economic Surprise Index, with the former leading the latter by approximately three months. In other words, today’s elevated policy pressures will gradually erode economic data performance in the months ahead and ultimately dampen market sentiment.
“This is going to catch people off guard,” Paulsen said in a Bloomberg phone interview. “We’ve just come out of a phase where Wall Street was raising targets to 8,000 and 8,500.” He previously held positions at Leuthold Group and Wells Capital Management.
Inflation data continues to deteriorate, and U.S. Treasury yields remain under pressure at elevated levels
Inflationary pressure represents another core risk currently facing the market. Last week’s data showed that producer prices rose at their fastest pace in over three years, and the May CPI also accelerated. The yield on the 10-year U.S. Treasury note briefly surpassed 4.55% earlier this month, prompting markets to reprice inflation expectations.
More concerning is the possibility that subsequent data could deteriorate further.
Gerard MacDonell of 22V Research expects core personal consumption expenditures (PCE) for May to rise by 25 basis points month-over-month, noting, 'This would mark the sixth consecutive month of disappointing-to-terrible inflation data.'
The impact of high interest rates on the market has been particularly evident in technology stocks.
Brian Jacobsen, Chief Economist and Strategist at Annex Wealth Management, noted: 'Much of the value of growth stocks comes from the future—sometimes the distant future. When inflation rises and interest rates increase, the present value of that future growth shrinks significantly.'
Keith Lerner, Chief Investment Officer at Truist Advisory Services, wrote in a client report that recent selloffs have coincided with the continued rise in the 10-year Treasury yield, compounded by a sharp repricing in tech stocks and persistent geopolitical uncertainty in the Middle East, collectively amplifying market stress.
Iran peace deal offers short-term relief, but risks remain
Markets received a positive signal this week: Trump stated that final terms of a U.S.-Iran peace agreement are about to be signed, prompting a sharp rebound in the S&P 500 and Nasdaq 100 indices and a corresponding drop in oil prices. Energy prices had previously been a key concern for inflation watchers.
However, several analysts remain cautious. 'I won’t get overly optimistic about this until the deal is actually signed—it’s likely just a temporary reprieve,' said Jacobsen.
Paulsen emphasized that even if oil prices have indeed peaked, the loss of economic and market momentum may still be unavoidable. 'When oil prices rise, the economy gets hurt—but the real damage typically shows up only after prices peak. That holds true for both the market and the economy,' he said.
The 'False Sense of Security' from the Economic Surprise Index
Currently, the Citi Economic Surprise Index is at its highest level since 2023, which—when viewed in isolation—appears to signal that 'all is well.'
However, Paulsen’s research highlights a key limitation of this indicator: it reflects how past economic data has exceeded expectations, not the direction of future trends.
According to Ned Davis Research, when the Surprise Index is above 22, the S&P 500 averages an 11% gain over the following 12 months; when the index ranges between 22 and -16, returns drop to 9.5%; and when it falls below -16, gains narrow further to 6.7%. Once actual economic data begins to fall short of expectations, this critical pillar supporting market gains will start to erode.
Mark Malek, Chief Investment Officer at Muriel Siebert & Co., offers a vivid analogy: 'Wall Street is watching the rocket launch while the macroeconomic basement is flooding.' He argues that investors, captivated by strong tech earnings and major events like the SpaceX IPO, are overlooking mounting economic risks.
Editor/Deng