
The first half of 2026 in global capital markets concluded amid extreme divergence and heightened volatility. The interplay between sudden geopolitical shocks and the deepening evolution of AI-driven technological transformation has reshaped the pricing dynamics across asset classes. At this mid-year juncture, reviewing the market trajectory of the past six months and projecting the path ahead for the remainder of the year is critical to identifying the key investment themes going forward.
Middle East Tensions and Crude Oil: From Risk Premium Back to Supply-Demand Dynamics
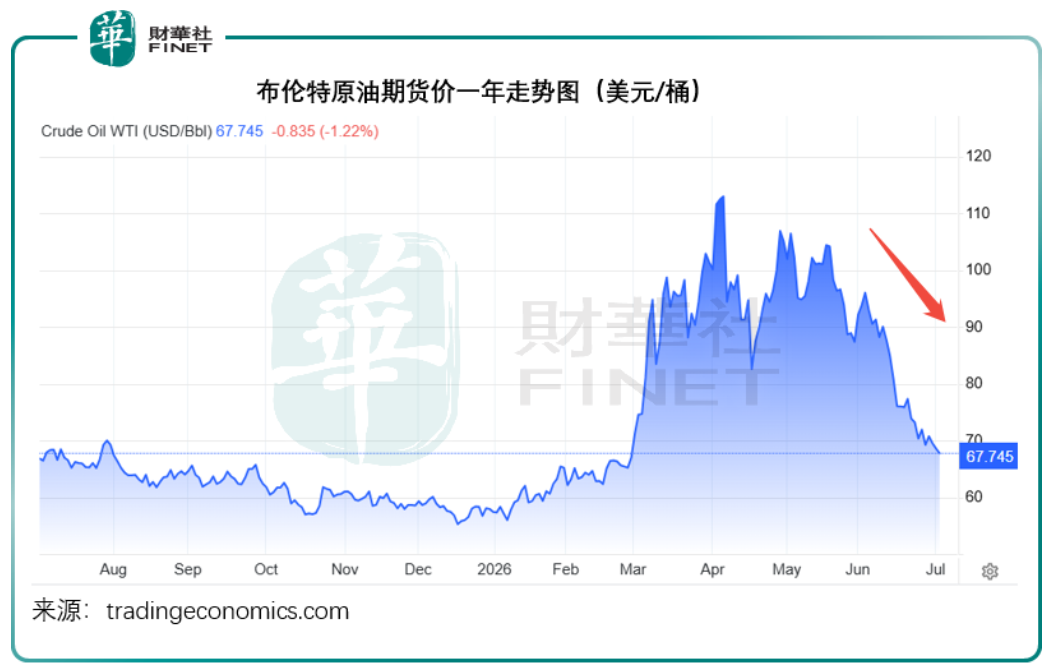
Crude oil was undoubtedly the dominant force in the commodities market in the first half of the year. At the beginning of the year, geopolitical tensions around the Strait of Hormuz escalated sharply, sparking rapid market fears of a disruption to global crude supply chains. This drove Brent crude prices from around $70 per barrel up to a peak of $120 per barrel, with geopolitical risk premium becoming the central driver of short-term oil pricing.
However, unlike previous geopolitical conflicts that triggered sustained bull markets, this rally proved short-lived. Following the announcement of a temporary U.S.-Iran ceasefire memorandum and amid deeper shifts in global crude supply-demand fundamentals, oil prices quickly retreated back to the $70-per-barrel range, completing a full short-term bull-bear cycle.
 As shown in the chart below, current$Brent Crude (Cash) Continuous Futures (2609) (BZmain.US)$has fallen below $68. On one hand, global demand may be weaker than expected; on the other, supply is increasing. The UAE, having distanced itself from OPEC+, may boost output, and its crude exports have already returned to pre-conflict levels via alternative routes. Additionally, with the Strait of Hormuz now reopened, previously delayed shipments could flood the market in the near term. Despite significant uncertainty surrounding U.S.-Israel negotiations, crude prices have temporarily lost upward momentum.
Is Inflation Driven by an 'Energy Story' or a 'Structural Story'?
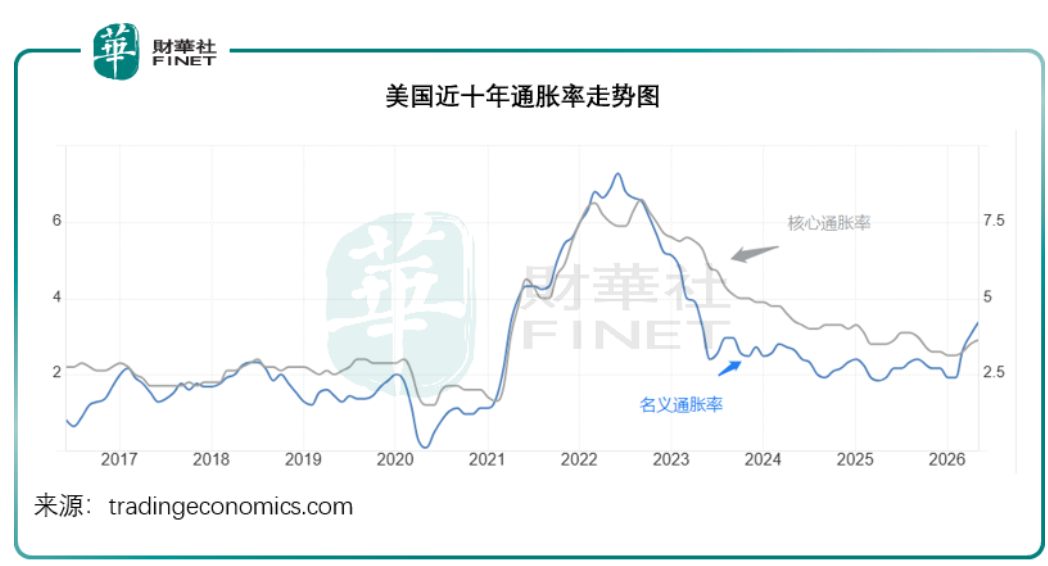
In May 2026, the U.S. annual inflation rate rose by 4.2%, marking the largest increase since April 2023. As shown in the chart below, this uptick began in March—coinciding with heightened geopolitical risks—and oil prices also started surging from that point. However, core inflation, which excludes energy and food prices, remained steady at 2.9%, creating a notable gap with headline inflation. This indicates that the second-quarter inflation spike was largely driven by energy prices.
Looking ahead from the mid-year mark, both crude oil and inflation markets remain exposed to two-way risks. In the short term, ongoing volatility in U.S.-Iran negotiations and the persistent possibility of renewed shipping restrictions in the Strait could quickly reignite geopolitical risk premiums in oil prices. Yet, clear downward pressures exist over the medium to long term: internal willingness to increase production within the OPEC+ coalition is gradually rising, and accelerating adoption of new energy sources may well constrain long-term growth in crude oil demand.
Global Interest Rate Trajectory: Is Monetary Easing No Longer Viable?
Persistent disruptions from energy-driven inflation will continue to delay the pace of interest rate cuts by major global economies. Recently, the Governor of the Bank of England stated that conditions are not yet ripe to consider rate cuts, while the President of the European Central Bank noted that risks to inflation and economic growth in the eurozone have become more balanced than they were a few weeks ago. Federal Reserve Chair Kashkari reiterated the commitment to the 2% inflation target. All these signals indicate that major central banks are unlikely to cut rates until the longer-term impact of oil prices on inflation becomes clearer.
In fact, major central banks have recently tightened monetary policy. The European Central Bank raised rates by 25 basis points on June 11—the first hike since September 2023. The Bank of Japan also hiked rates by 25 basis points on June 16, bringing its policy rate back to 1% for the first time in three decades. Meanwhile, the Bank of England held its rate steady at 3.75%. However, the Federal Reserve remains under closer scrutiny.
Kashkari, nominated by Trump, does not appear to be pursuing the accommodative monetary policy Trump had hoped for. Recently, Kashkari remarked that those expecting looser policy would be 'disappointed,' signaling a more hawkish stance. Market bets on a Fed rate hike in September have increased.
See the chart below,$US 10-Year Treasury Yield (US10Y.BD)$has risen significantly.
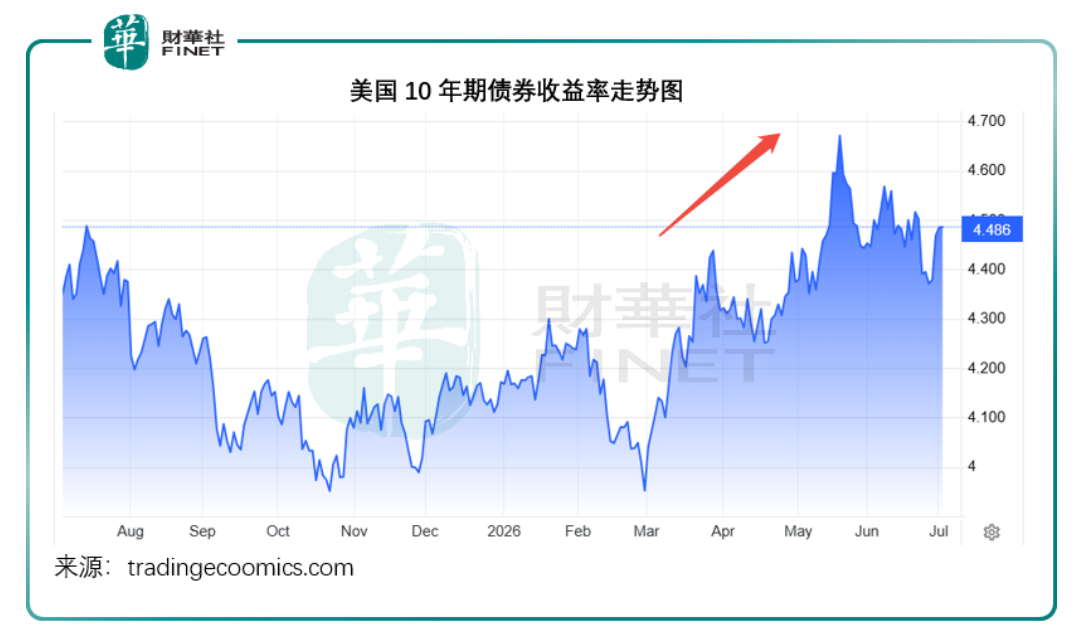
Interest rates and bond prices move inversely; rising rates mean lower bond prices, indicating lackluster performance in the bond market with limited investor appetite for bonds. Interestingly,$U.S. Dollar Index (USDindex.FX)$is rising.
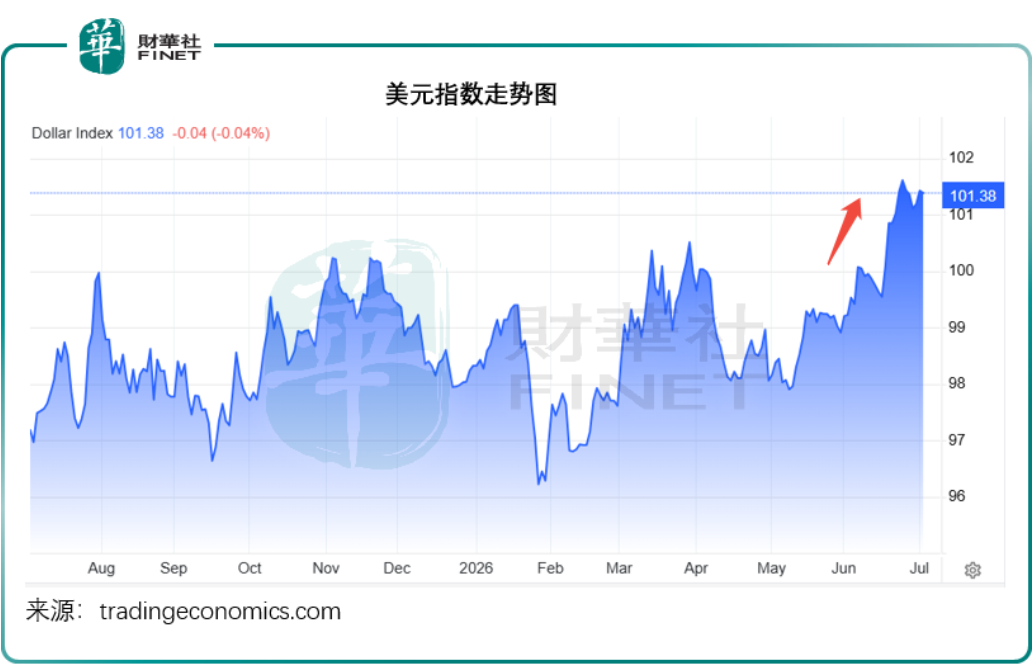
Against this backdrop, the U.S. Dollar Index—which measures the dollar against a basket of major currencies—has strengthened notably. As shown in the chart below, in the last week of June,$U.S. Dollar Index (USDindex.FX)$it has returned to the 100 level and has now climbed further above 101.
Expectations of rate hikes, easing geopolitical tensions, and a stronger dollar have pushed gold prices—denominated in U.S. dollars—lower from recent highs. As illustrated in the chart below, gold futures prices have retreated from above $5,200 earlier this year—when Middle Eastern geopolitical risks escalated—to around $4,000 recently.
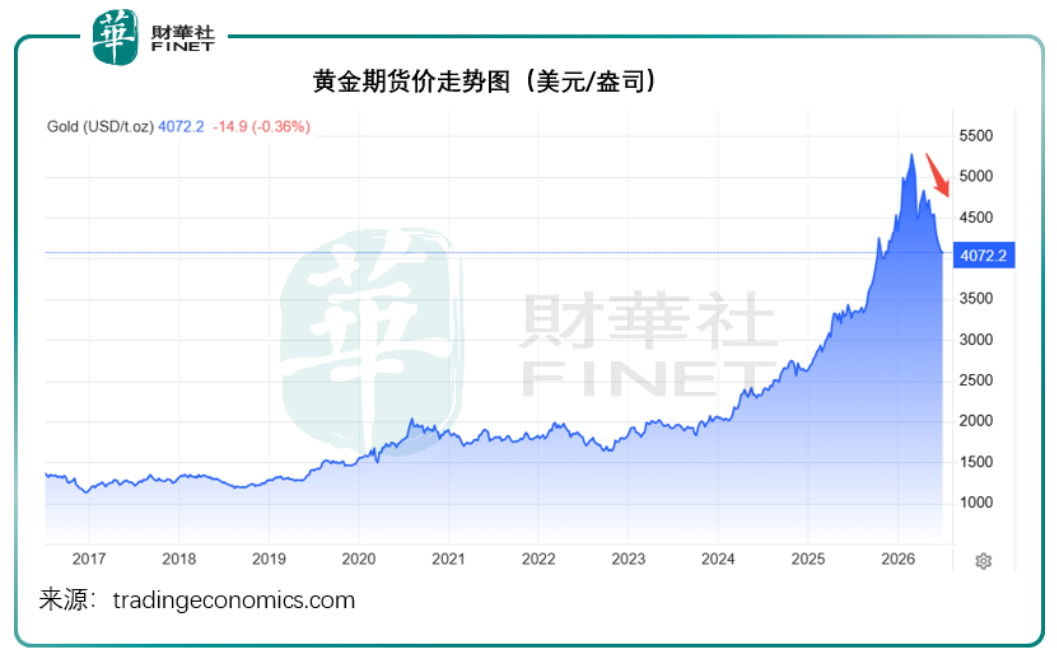
Notably, the current surge in the U.S. dollar’s strength is not the result of global investors actively allocating to safe-haven assets, but rather a consequence of passive global liquidity contraction. The Federal Reserve’s ongoing balance sheet reduction has tightened global liquidity, prompting overseas capital to offload large volumes of Asian and emerging market assets to mitigate emerging market risks and repatriate funds as a defensive measure, thereby passively driving up the U.S. Dollar Index.$SpaceX (SPCX.US)$We believe that the substantial fundraising scale of major U.S. equity IPOs, along with optimistic forward-looking guidance from AI suppliers, has also been a significant factor attracting capital back to the United States.
Global Equity Markets: Valuation Reconfiguration and the Liquidity Turning Point Amid Extreme Divergence
In the first half of 2026, global equity markets exhibited extreme structural divergence, shaped by the interplay between the AI-driven technological revolution and macro liquidity dynamics. On one hand, the upstream AI supply chain—particularly semiconductors—experienced an unprecedented valuation expansion. On the other hand, foreign capital outflows and concerns about potential compute capacity oversupply are compelling the market to reassess the sustainability of this technology-driven bull run.
1) Secondary Market Performance: Upstream AI Frenzy vs. Downstream 'Bleeding'
According to Wind data, the total market capitalization of South Korea’s equity market surged from USD 2.52 trillion at the end of 2025 to USD 4.59 trillion, marking a six-month gain of 82.31%. This rally was primarily driven not by new listings but by explosive growth in individual stock valuations. We note that only 28 new companies were listed in the first half of 2026, while the benchmark index tracking the broader Korean equity market$Korea Composite Index(.KOSPI.KR)$soared by a remarkable 101.14%, outperforming all other global markets.
Accompanying this market cap surge has been a comprehensive valuation re-rating. Wind data shows that the trailing twelve-month (TTM) price-to-earnings (P/E) ratio of the Korean equity market rose sharply from 13.60x before the semiconductor rally began in 2024 to 22.66x, while the price-to-book (P/B) ratio jumped from 0.92x to 2.41x.
The primary driver has been acute supply-demand imbalances in memory chips fueled by AI development, which triggered massive capital inflows into South Korea’s two leading memory chipmakers,SK Hynix (000660.KR)and$Samsung Electronics (005930.KR)$—the two giants together command a 79% share of the global HBM market, among whichSK Hynix (000660.KR)It even leads the market by a wide margin, with a market share as high as 58%, as shown in the chart below. HBM is currently an essential and mainstream component in AI servers.
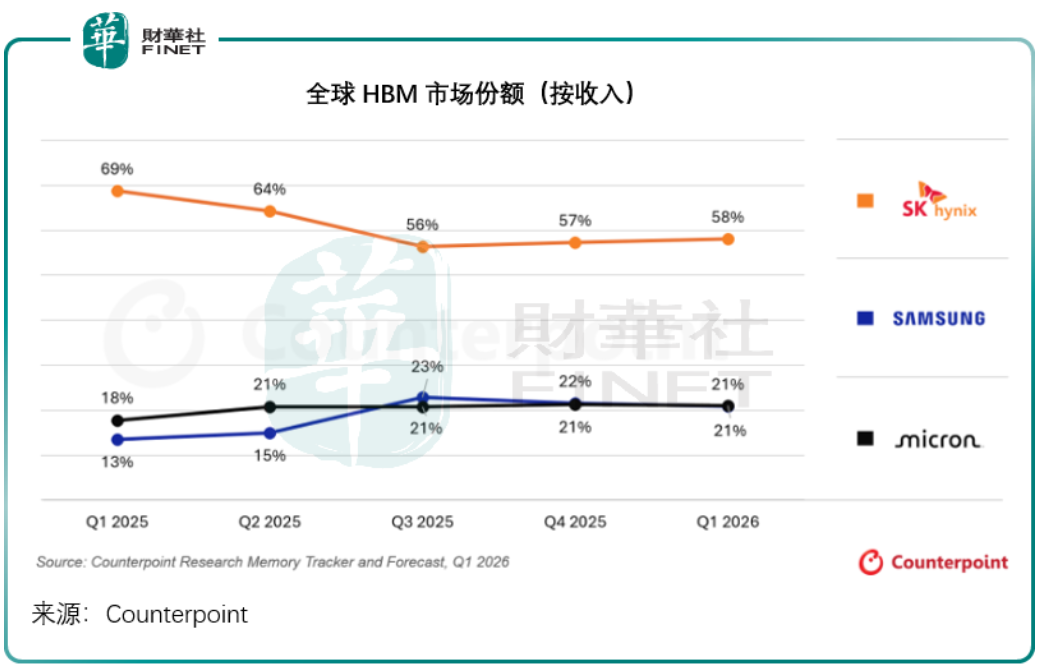
In the first half of this year, SK hynix and Samsung Electronics saw their share prices surge by 294.03% and 179.14%, respectively. Together, these two giants account for nearly half of the total market capitalization of the Korean benchmark index.
Interestingly, South Korea’s KOSDAQ index—a growth enterprise market benchmark—declined by 1.00% in the first half of the year, as shown in the table below, sharply contrasting with the broader market. The surging valuations of the two semiconductor titans have masked the true state of the Korean equity market: extreme divergence, with semiconductors soaring while other assets underperformed.
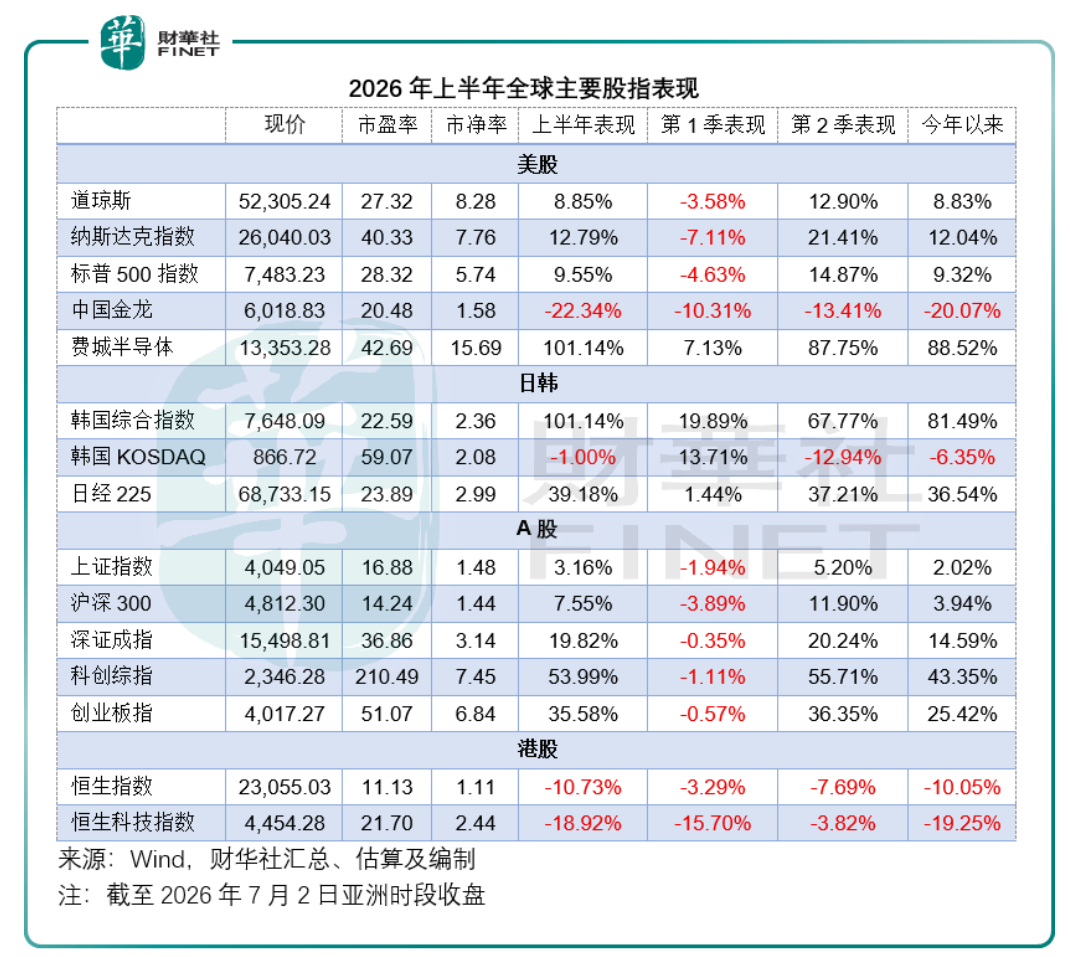
In fact, other markets are also exhibiting this kind of 'lopsided' performance.
The Dow Jones Industrial Average, which tracks U.S. blue-chip stocks, posted a cumulative gain of 8.85% in the first half of the year. Meanwhile, the 'Magnificent Seven'—which have historically led bull markets—delivered only mediocre performance during the same period, with their individual year-to-date returns ranging from -20.19% to 14.20%. The Wind U.S. Mag 7 Index has risen just 1.19% so far this year, significantly underperforming the broader market.
From the perspective of the AI supply chain, the 'Magnificent Seven' operate primarily at the execution and application layers, with some positioned further upstream.NVIDIA (NVDA.US)Take NVIDIA as an example: it supplies chips to the other six members of the group, yet it also relies heavily on upstream semiconductor suppliers—for instance, it needs to purchase large quantities of chips from companies such as Taiwan Semiconductor and Micron Technology.SK Hynix (000660.KR)、$Samsung Electronics (005930.KR)$、$Taiwan Semiconductor (TSM.US)$、Micron Technology (MU.US)In other words, the massive capital expenditures committed by the 'Magnificent Seven' to AI infrastructure will directly benefit their upstream suppliers.
Indeed, an index tracking upstream semiconductor supply chain stocks surged by 101.14%.$PHLX Semiconductor Index (.SOX.US)$Whether the AI computing power and applications that the 'Magnificent Seven' are building will successfully generate new revenue streams—and thereby create a second growth curve—remains uncertain. However, their enormous capital spending is already being reflected immediately in the performance of upstream players in the supply chain. This dynamic is a key driver behind the current extreme market divergence.
A-shares have similarly reflected this extreme market trend. The STAR Market Composite Index and the ChiNext Price Index surged by 53.99% and 35.58%, respectively, in the first half of this year, driven by upstream suppliers such as optical module maker 'Yi Zhongtian,' optical chip suppliers,$Yuanjie Technology (688498.SH)$, semiconductor suppliers,$Cambricon (688256.SH)$, and suppliers of ceramic packaging materials for semiconductors,$Three-Circle Group (300408.SZ)$among other upstream suppliers, all of which posted cumulative gains measured in multiples during the first half of this year. In contrast, downstream sectors—including consumer goods, liquor, automobiles, and software services—have remained under persistent pressure.
Many leading Japanese firms dominate the supply of AI-related upstream materials and semiconductor components. Coupled with a weak yen boosting export competitiveness, Japanese equities also delivered strong performance, with the$Nikkei 225 (.N225.JP)$index rising by 39.18% in the first half of this year.
In comparison, the Hong Kong stock market suffered significant losses,$Hang Seng Index (800000.HK)$and$Hang Seng Tech Index (800700.HK)$with declines of 10.73% and 18.92%, respectively, in the first half of the year. The primary reason is that most Chinese tech giants listed in Hong Kong operate in the downstream segment of the AI value chain. While they possess extensive and mature service ecosystems, weaker-than-expected domestic demand—combined with substantial capital expenditures required to procure chips from upstream suppliers, build computing capacity, and construct data centers to keep pace with AI development—has heightened near-term earnings uncertainty, prompting capital outflows from these stocks toward AI hardware and chip plays.
2) IPO Market: A Liquidity Bonanza Led by SpaceX
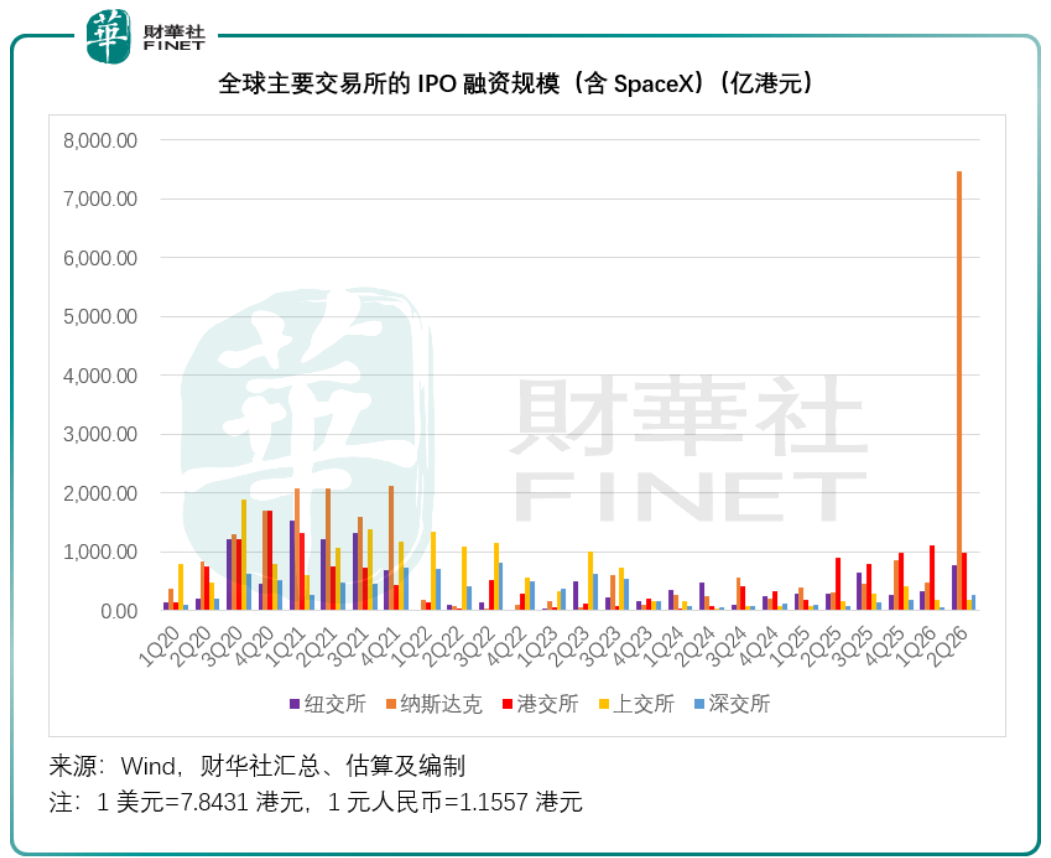
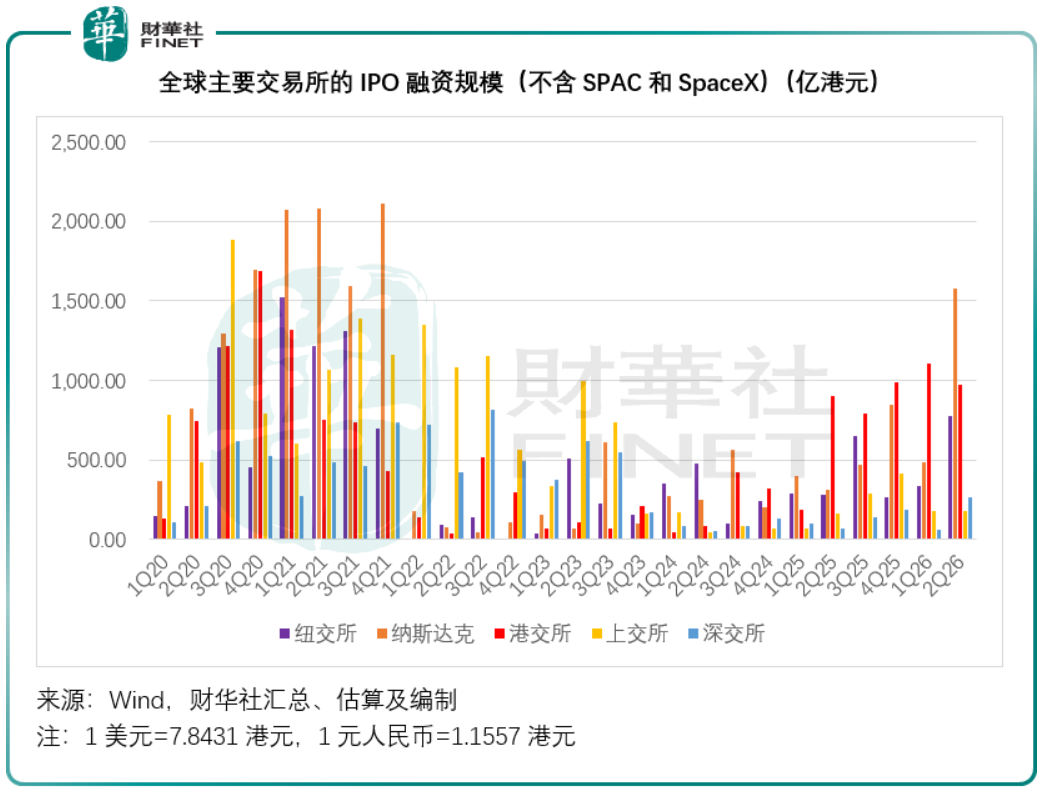
Robust activity in the primary market has provided sentiment support to the secondary market. In the first half of 2026, global IPO fundraising surged sharply (see chart below). In Q1, the Hong Kong Stock Exchange ranked among the top exchanges by IPO proceeds, but by Q2, Nasdaq stood out significantly due to$SpaceX (SPCX.US)$a massive $75 billion 'mega-IPO.' Even excluding SpaceX, Nasdaq’s Q2 IPO fundraising still reached $20.126 billion (approximately HK$157.883 billion), substantially exceeding the Hong Kong Stock Exchange’s HK$97.623 billion over the same period. However, the concentrated issuance of mega-IPOs is testing the tolerance limits of existing market liquidity. SpaceX’s listing alone absorbed substantial liquidity, exerting clear capital diversion pressure on traditional technology heavyweights.
OpenAI (valued at $852 billion) and Anthropic (valued at $965 billion) are expected to launch their IPOs as early as by the end of September. Their combined fundraising is likely to surpass that of SpaceX. Given that SpaceX has already drawn significant liquidity from the market, consecutive listings by these two AI giants would further intensify the diversion effect on existing capital in financial markets.
3) Capital Reallocation: Record-Breaking Foreign Capital Outflows
Beneath the surface of the global tech stock rally, underlying capital flows are sending warning signals. According to LSEG data, in the first half of 2026, overseas investors withdrew a net total of $137.36 billion from equity markets in Asian emerging economies—including South Korea, Taiwan, India, Indonesia, Thailand, Vietnam, and the Philippines—marking the largest semi-annual outflow since records began in 2010. South Korea, which had experienced the sharpest gains earlier in the year, was hit hardest, suffering $70.8 billion in net foreign outflows. In June alone, foreign investors sold $27.08 billion worth of equities in the region, including $12.63 billion in South Korea, $8 billion in Taiwan (a hub for upstream semiconductor manufacturing and related supply chains), and $5.91 billion in India.
Does this shift in industry dynamics signal a turning point for market performance in the second half of the year?
This round of capital withdrawal from emerging markets is primarily driven not by deteriorating fundamentals, but by institutional portfolio rebalancing following extreme overcrowding in AI upstream sectors.
After a six-month surge that doubled valuations, stocks in AI upstream segments—such as semiconductors, HBM, advanced packaging, and photonics—have become severely overvalued. Institutional holdings have reached historically high concentration levels, and leverage ratios are also elevated. Recent estimates from Fitch indicate that the adjusted net leverage ratio of South Korea’s securities industry has risen to approximately 8x–9x, compared to an average leverage ratio of less than 7x across the country’s 61 brokerages at the end of 2025.
Compounded by the Federal Reserve’s continued monetary tightening, overseas capital has opted to take profits en masse and reallocate funds back to U.S. equity markets, triggering sharp volatility in Japanese and South Korean equities. This suggests that the AI upstream hardware-driven rally, fueled purely by sentiment and liquidity, is ultimately unsustainable.
On July 1, reports indicated that$Meta Platforms (META.US)$Preparing to sell idle computing capacity to external customers and enter the cloud computing market could position it to compete with$Amazon (AMZN.US)$Amazon’s AWS,$Microsoft (MSFT.US)$Microsoft’s Azure, and Google Cloud in the cloud computing space—a move that may prompt the market to confront a key question: Is global computing capacity oversupplied?
Over the past two years, both the 'Magnificent Seven'—including Microsoft and Amazon—and Chinese tech giants such as$Alibaba-W (09988.HK)$、Tencent (00700.HK)have committed substantial capital expenditures to build out computing infrastructure. For example, Meta’s capital expenditures were $28 billion in 2023, $39 billion in 2024, and are projected at $72 billion for 2025; by 2026, its planned capital expenditures range between $125 billion and $145 billion.
However, whether these capital investments will generate commensurate returns has remained a persistent market concern and a key reason behind the sustained valuation pressure on these downstream operators.
Over the past two years, the AI sector’s upstream segment surged amid a dominant narrative of computing capacity shortages, insufficient chip supply, and persistent scarcity of production capacity. Yet as global cloud providers implement large-scale capital expenditure plans, leading firms now face significant excess capacity in their own computing infrastructure. For instance, Meta’s decision to lease out idle capacity to fill gaps in third-party computing rental markets may signal that the current expansion cycle for computing capacity has peaked.
Of course, some market participants argue that Meta is seeking to diversify its business and reduce overreliance on advertising revenue. In fact, companies like Tencent and even SpaceX have also leased idle computing capacity to third parties, so Meta is not alone in this approach.
Regardless of interpretation, Meta’s move marks a shift in AI computing from infrastructure build-out toward computing-as-a-service. As more AI computing capacity transitions from ‘capital expenditure’ to ‘lease-based revenue,’ the pricing power and scarcity premium of upstream hardware vendors will likely undergo reassessment, while the undervaluation and latent revenue potential of downstream operators could offer compelling reasons for capital allocation.
Excessive concentration in holdings of upstream operators may drive an increasing number of fund managers to seek new investment opportunities—for example, in relatively undervalued downstream players with comprehensive service ecosystems.
Core Market Insights for the New Cycle
Reflecting on the turbulent first half of 2026 in global capital markets, the volatility may have laid the groundwork for market dynamics in the second half. Standing at this mid-year inflection point—amid elevated valuations and an impending liquidity turning point marked by underlying tensions—the market will seek a new equilibrium through differentiation and restructuring.
First, exercise caution regarding 'crowded trades' and valuation reversals in AI upstream sectors. In the first half of the year, AI upstream supply chains—represented by semiconductors and HBM—experienced an epic valuation expansion driven by extreme supply-demand narratives. However, as institutional ownership concentration reaches historic highs and industry giants (such as Meta Platforms) begin leasing out idle computing capacity, the market must confront growing concerns over potential overcapacity in AI compute infrastructure. In the second half, rallies in pure hardware plays—fueled solely by sentiment and liquidity—are unlikely to be sustainable. Investors should shift from a 'penetration rate' mindset to a 'cash flow' mindset to mitigate the risk of valuation corrections stemming from unmet expectations.
Second, align with capital reallocation trends and capitalize on the style rotation from 'upstream infrastructure build-out' to 'downstream applications.' As foreign investors withdraw from Asian emerging markets at record levels and mega IPOs in the private markets absorb existing liquidity, a global equity market liquidity inflection point will eventually materialize. Against the backdrop of severely overextended valuations in AI upstream segments, capital is likely to seek new safe havens. AI downstream operators and legacy internet leaders—with expansive service ecosystems and relatively undervalued stocks—could present compelling opportunities for valuation recovery.
Third, recalibrate the macro pricing framework. Persistent energy-driven inflationary pressures and hawkish signals from major central banks—particularly the Federal Reserve—may signal a temporary end to the global easing cycle. In this context, the strength of the U.S. dollar may stem not from active risk aversion but rather from passive global liquidity contraction. This implies that pricing across global asset classes in the second half will be tightly linked to the trajectory of real interest rates. Until the true liquidity turning point arrives, high-valuation assets will remain under persistent pressure, while traditional safe-haven assets such as gold—after enduring liquidity-driven sell-offs—may gradually reveal their long-term strategic allocation value in a high-volatility environment.
In summary, the second half of 2026 in global capital markets will be defined by a tug-of-war between 'earnings validation' and 'expectation adjustments.' Amid extreme market divergence, only those who maintain strategic discipline, reduce concentration in single assets, and construct antifragile portfolios amid uncertainty will successfully navigate the cycle and capture structural opportunities in the emerging equilibrium.
Editor/melody