
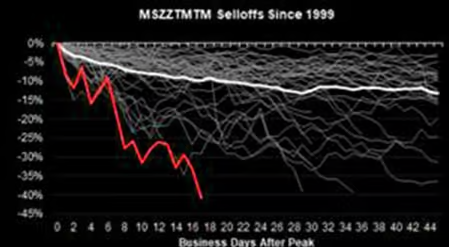
Goldman Sachs partner Mark Wilson noted that the current sell-off has lasted for 17 trading days, with the U.S. equity momentum factor down 28% from its peak and the TMT momentum factor plunging by as much as 40%, marking the fastest and deepest drawdown in history. The root cause lies in crowded positioning and concentrated leverage, rather than deteriorating fundamentals.
He believes the deleveraging process is 'nearing completion,' but a near-term catalyst for reversal remains absent. Valuations remain elevated, structural market risks persist, and clarity on the next directional rotation will likely emerge only after earnings reports over the summer are fully digested.
Technology momentum trading is undergoing its most severe unwinding on record. In just 17 trading days, the U.S. tech momentum factor (TMT MoMo) has plunged 40% from its peak, marking the fastest and deepest drawdown in history, with ripple effects spreading across semiconductors, hedge funds, and credit markets.
 Mark Wilson, Partner at Goldman Sachs and Head of EMEA Hedge Fund Coverage, provided a systematic review this week of this "brutal rotation," noting that the speed and depth of the sell-off are historically rare but stem primarily from non-fundamental factors such as crowded positioning and concentrated leverage, rather than any material deterioration in the economy or corporate earnings. He indicated that the unwinding of momentum positions is "nearing completion," though there is currently no immediate catalyst for a reversal in the near term.
Notably, this momentum collapse is unfolding against a backdrop of generally sound macroeconomic and corporate fundamentals—U.S. banks reported a 17% year-over-year increase in corporate lending, Taiwan Semiconductor raised its 2026 revenue growth guidance to above 40%, and inflation data have come in mildly below expectations. This divergence between strong fundamentals and adverse price action represents the core contradiction in today’s market.
The technology momentum factor is experiencing its steepest sell-off ever, with both the speed and depth of the drawdown exceeding historical medians.
According to Morgan Stanley’s Quantitative and Derivatives Strategy (MS QDS) team, this momentum factor drawdown has lasted 17 trading days, with a peak-to-trough decline of 28%. By comparison, the median historical drawdown for the momentum factor since 1999 has been 22%, typically unfolding over an average of 33 trading days.
This means the current decline has already surpassed historical medians in both speed and depth, making it the most severe since the 29% drawdown between December 2022 and February 2023.
Conditions in the technology sector are even more extreme. The TMT momentum factor (TMT MoMo) has fallen 40% from its peak, which, according to MS QDS data, marks the fastest and deepest sell-off ever recorded for a tech momentum factor.
Across subsectors,$Korea Composite Index (.KOSPI.KR)$the broader tech sector is down 27% from its peak, U.S. AI-related equities have fallen 25%, global memory chip stocks are down 36%, and European semiconductor stocks have declined 23%. Memory chip stocks account for approximately two-thirds of the total decline, while the broader basket of AI beneficiaries is down roughly 24% from its high.
Low surface-level volatility masks intense internal stress—the market’s risk structure is unraveling.
Price declines are merely the visible symptom of this turmoil; equally noteworthy are the underlying shifts in the market’s internal risk structure.
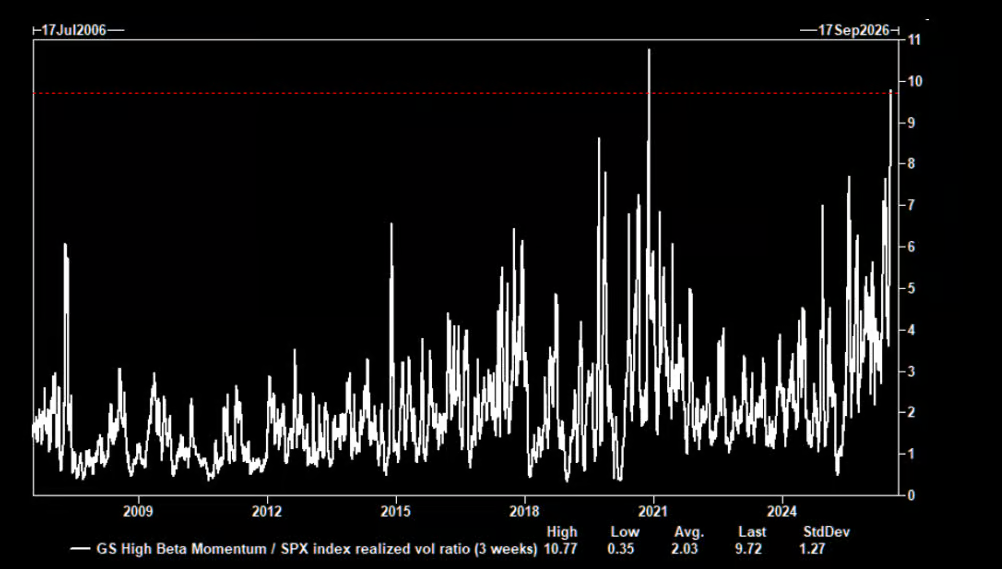
According to Goldman Sachs’ volatility trading desk, the current volatility of the Goldman Sachs High-Beta Momentum Portfolio (GSPRHIMO) stands at approximately$S&P 500 Index (.SPX.US)$10 times that of broader market volatility. In historical backtesting over the past 20 years, such a pronounced volatility ratio has been observed only once before—during the pandemic shock in November 2020.
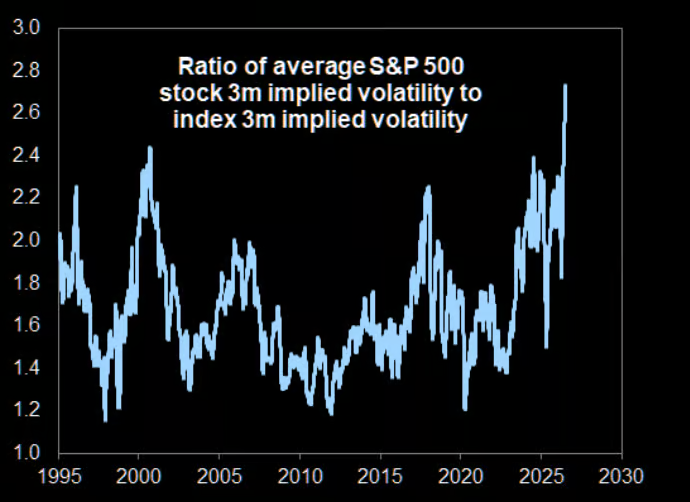
Meanwhile, the gap between single-stock volatility and index volatility has widened to a historical extreme. Goldman Sachs data show that the 3-month implied average correlation among S&P 500 constituents fell this week to a record low of 0.14, keeping the S&P 500’s implied volatility subdued while the average implied volatility of individual stocks surged to 40%—2.8 times the index’s implied volatility—also a historical high.
Positions remain crowded, and risks have yet to be fully unwound.
Despite the momentum factor recently experiencing a historically significant drawdown, hedge funds’ net exposure to it remains elevated from a long-term perspective. According to JPMorgan data, the combination of current positioning and the magnitude of the drawdown continues to mark the momentum factor as one of the market’s most noteworthy core risks.
Meanwhile, the Goldman Sachs High-Beta Momentum Factor has declined 33% from its June peak, with its year-to-date gain shrinking sharply from 60% to just 12%, a development also noted by Mark Wilson.
He cited signs of deleveraging in the Korean market as supporting evidence: reports indicate that approximately 1 in every 30 Korean adults had their margin stock accounts forcibly liquidated this week, signaling that the deleveraging process is already well underway.
Fundamentals remain sound; the risk lies in positioning and structure.
What makes this momentum unwind unusual is that it is occurring against a backdrop of broadly improving corporate fundamentals and macroeconomic data.
Mark Wilson pointed out that U.S. bank earnings reports this week offered an “unmistakably positive read” on economic conditions: corporate loan balances grew 17% year-over-year, a record high spanning all sectors of the economy; U.S. consumer spending tracked at a mid-single-digit pace, with credit card spending up 6%; investment banking-related businesses collectively grew by more than 40%; and large banks reported a tangible common equity return on equity (ROTE) of 19%, the highest since the financial crisis.
On the technology capital expenditure front,$Taiwan Semiconductor (TSM.US)$revenue growth guidance for 2026 has been raised to above 40% (based on a revenue base exceeding USD 150 billion),$ASML Holding (ASML.US)$and its earnings report has prompted market expectations for upward revisions of 15% to 30% in earnings per share over the next one to three years.
However, shares of both companies declined following the earnings announcements, exhibiting a classic 'sell-the-news' pattern. In contrast, IBM posted its largest single-day drop in over two decades due to delays in large contracts and underperformance in its consulting business.
Mark Wilson emphasized that this round of selling "lacks clear signals at the fundamental level" and reflects more structural factors such as positioning, leverage, crowding, and concentration.
Rotation is nearing its end, but a catalyst for reversal has yet to emerge.
Mark Wilson stated that he is inclined to believe the unwinding of momentum factors is approaching its conclusion, but noted that there is currently a lack of near-term summer catalysts capable of immediately triggering a market reversal.
He also pointed out that as efficiency and commercial execution capabilities improve, new market leadership sectors will gradually emerge, broadening market participation—an example being the Dow Jones Transportation Average, which recently broke to a new high again this week.
However, he also warned that the second derivative of earnings growth—that is, the deceleration in the pace of growth—will become increasingly important after the market fully digests second-quarter earnings and moves into the summer period, while current valuation metrics across the board continue to indicate that tech sector valuations remain elevated.
Furthermore, correlations both across traditional asset classes and within individual assets are exhibiting unusual breakdowns—for instance, the 3-month correlation between gold and crude oil has fallen to an extreme negative level unseen in the past 35 years, further complicating risk management and portfolio construction.
Editor/melody