
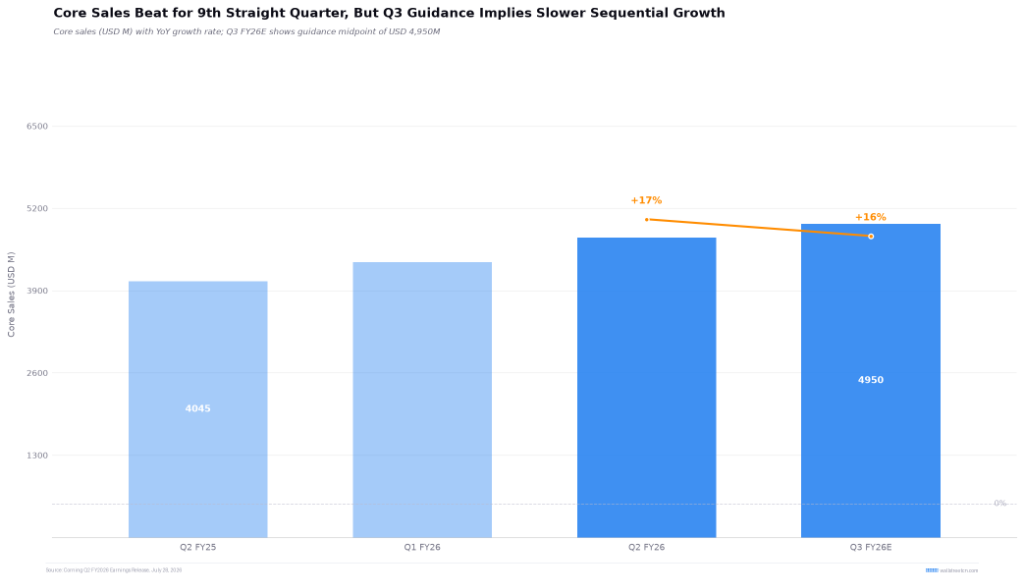
Corning reported a 17% increase in Q2 revenue and a 30% rise in profit, with optical communications revenue up 32% year-over-year. However, its Q3 core sales guidance of $4.9–5.0 billion has an upper end that merely meets expectations, implying a sharp sequential deceleration in growth from 9% to 3–6%.
The AI bull market has reached a make-or-break moment—earnings results that fall short of being impressive enough can trigger a sharp market reaction.
On Tuesday, Corning released its Q2 earnings report, and its shares plunged more than 14% in early U.S. trading—not because of poor results, but due to underwhelming guidance for Q3. The company guided for core sales of $4.9–5.0 billion, with the upper end merely in line with expectations and the midpoint of $4.95 billion slightly below consensus.
 Against the backdrop of multi-billion-dollar agreements with Amazon and long-term collaboration with NVIDIA having recently materialized, the market was expecting not just ‘in-line’ results, but a significant upward revision. Instead, the Q3 revenue guidance offered no upward adjustment; moreover, the implied sequential growth rate dropped sharply from 9% in Q2 to just 3–6%—a signal of deceleration rather than acceleration, which better explains the aggressive pre-market sell-off than the absolute revenue figure itself.
This is not an isolated correction. Prior to the earnings release, the stock had already pulled back roughly 40% from its late-June highs of approximately $255–271 to around $145. Combined with the additional 15% pre-market drop, the cumulative decline over two months approaches 50%. This is not a mere adjustment—it is a repricing.
Q2 results beat across the board—but they are already history.
Objectively speaking, there is little fault to find with the Q2 numbers themselves. Core sales came in at $4.74 billion, up 17% year-over-year and exceeding expectations by approximately 2.3%. Core EPS was $0.78, up 30% year-over-year and beating estimates by 2.7–4%. Core operating margin expanded by 190 basis points year-over-year to 20.9%, and core ROIC rose by 180 basis points to 14.9%.
However, a closer look reveals that the quality of this earnings beat warrants scrutiny.
The new reporting methodology introduced in Q2—adjusting for hedging exposure—added approximately $233 million to core sales relative to GAAP figures, which alone accounted for the entirety of the earnings beat. This is not to suggest that the company is manipulating results (the change in methodology is reasonable), but rather that the incremental informational value of the ‘beat’ is thinner than the headline numbers imply.
Morgan Stanley had accurately anticipated this ahead of the earnings release: optical communications capacity was nearing full utilization, limiting Q2 upside to around $50 million. The actual beat of $130 million slightly exceeded that estimate but was far from sufficient to alleviate concerns about peak growth. The market sent a clear message: in a richly valued environment, backward-looking beats matter far less than forward-looking guidance.
High growth in optical communications hits a ceiling.
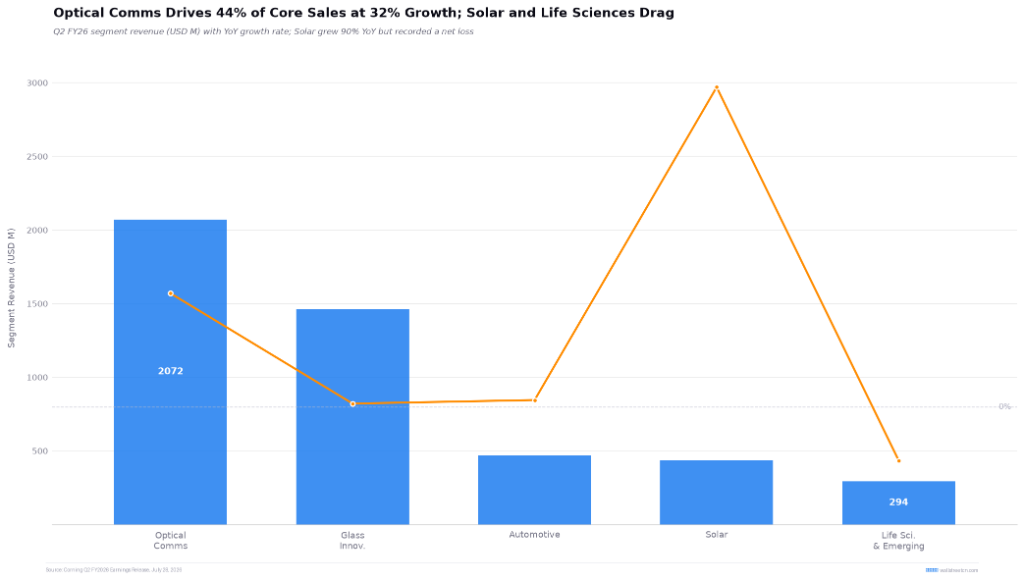
Optical Communications generated $2.07 billion in revenue for the quarter, representing 44% of core sales and a 32% year-over-year increase. Segment net income was $438 million, with a profit margin of 21.1%. Profit growth (+77%) more than doubled the pace of revenue growth. Enterprise networking grew by 65%, with generative AI–related products growing even faster. Judged solely on these figures, there is no flaw.
However, the issue lies not in Q2 but in what can be delivered in Q3. The implied sequential growth rate embedded in Q3 guidance has sharply declined from 9% to 3–6%, indicating management is already preparing for a slowdown. This guidance indirectly validates Morgan Stanley’s assessment that 'capacity is nearing sell-out'—if capacity cannot be rapidly expanded, sustaining 32% revenue growth in subsequent quarters will be difficult.
An even sharper concern is valuation. As early as May, JPMorgan provided a pointed rationale for downgrading the stock: investors are effectively paying for 2028 earnings, with the fiber optics business trading at a price-to-earnings ratio approaching 40x. At such a valuation base, the value of the partnership with Amazon and NVIDIA must be realized quarter by quarter—and the first signal from Q3 guidance is clearly insufficient.
Profit margins diluted; cash flow funded by prepayments
Core gross margin improved by 120 basis points year-over-year to 39.6%. However, the aforementioned hedge position adjustment contributed approximately $207 million at the gross profit level, impacting gross margin by roughly 4.6 percentage points. Additionally, $39 million in restructuring and impairment charges and $24 million in acquisition-related costs introduced noise across profit layers. While the direction of profit expansion is correct, its magnitude should be discounted accordingly.
The free cash flow figure withstands even less scrutiny. Adjusted free cash flow reached $1.42 billion, more than triple the prior-year level. However, 'customer deposits and government incentives' contributed $880 million—compared to just $59 million in the same period last year. NVIDIA’s $500 million warrant and customer prepayments tied to capacity commitments essentially represent 'exchanging future capacity for cash today.' Stripping out these one-time inflows reveals a much more modest underlying operational improvement.
Solar losses and life sciences contraction
Beyond Optical Communications, signals from the other four segments are even less encouraging. Solar revenue surged 90% year-over-year to $438 million but recorded a net loss of $7 million—compared to a $2 million profit in the same period last year and a $7 million profit in Q1. Extended maintenance and equipment upgrades at wafer fabs caused temporary shutdowns, turning a high-growth business into a loss-making one.
Management has pledged improvement in Q3, but promises do not guarantee delivery. Life Sciences and Emerging Growth Businesses fared even worse: revenue declined 15% year-over-year to $294 million, swinging from a $6 million profit to a $21 million loss. These two segments were positioned under the Springboard initiative as the next growth drivers following Optical Communications—but both relay batons are currently slipping. Glass Innovation (+1%) and Automotive (+2%) are also nearly stagnant.
Springboard’s $20 billion target is within reach, but $40 billion remains out of sight.
Q2 also updated the Springboard program targets: $20 billion annualized by end-2026, $30 billion by end-2028, and $40 billion by end-2030. Based on Q3 guidance of approximately $19.6–20 billion annualized, the 2026 year-end target has nearly already been reached. From Q4 2026 to Q4 2030, this implies a compound annual growth rate (CAGR) of roughly 19%.
The challenge lies in the fact that the near-term target has already been met ahead of schedule, naturally shifting market attention to the more distant horizons of 2028 and 2030.
The climb from $30 billion to $40 billion requires solar operations to transition from losses to large-scale profitability and automotive revenue to accelerate from 2% to double-digit growth—neither of which is currently supported by data or a clear timeline. A 19% CAGR is an extremely aggressive assumption in any industry. To some extent, the pre-market decline reflects a repricing of this assumption.
Conclusion
Corning delivered a strong Q2 performance, but the market had set an even higher bar given its share price above $200 and a 40x P/E multiple on its optical fiber business. The pre-market drop of over 15% sends an unambiguous message: when valuation has already priced in the most optimistic assumptions, merely meeting expectations amounts to underperformance—and Q3 guidance barely touched the upper end of expectations.
What’s worth watching next isn’t whether Q3 will beat again—it likely will—but rather three key questions: Can the capacity expansion ramp in optical communications meaningfully accelerate in Q3–Q4? Can solar deliver on management’s repeated promise of returning to profitability in Q3? And after this repricing, where does the market establish its new valuation anchor? For a stock that has fallen from nearly $270 to around $120, any assertion that ‘fundamentals remain sound’ must directly confront this question: if nothing is wrong, why has the share price halved?
 AI-Powered Earnings Insights: Build Your Options Strategy in Three Steps! Open Futubull > Stock Page > Tap [Company] >Earnings Update

Editor/lambor