
In the first half of 2026, the dominant theme in global markets will be the extreme divergence between AI-related and non-AI assets. However, such extreme divergence has also led to extreme crowding and overvaluation. Recent market turbulence reflects a sharp deleveraging process aimed at digesting this high degree of crowding and elevated valuations. South Korea, with its high leverage exposure, experienced an especially severe correction—since late June, global AI-related indices have broadly declined, with the KOSPI index一度 falling nearly 40% (Chart 1).
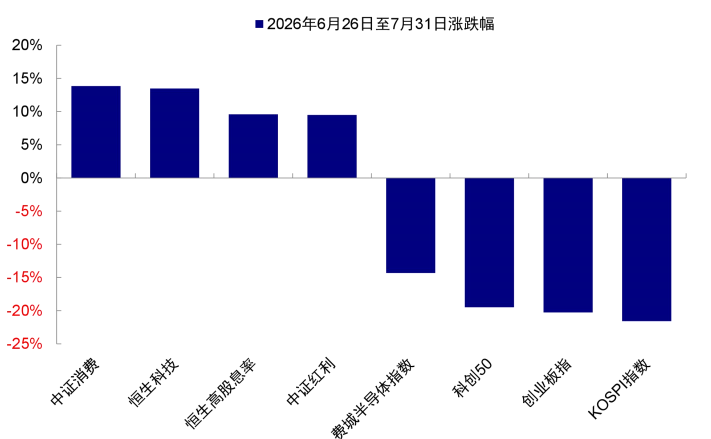
Meanwhile, dividend-paying stocks, consumer sectors—seen as 'mirror images' of AI—and Hong Kong equities have shown clear signs of recovery, with the Hang Seng Index rebounding by 14% from its trough (Chart 2).
Chart 1: Global AI-related indices have undergone significant corrections since late June
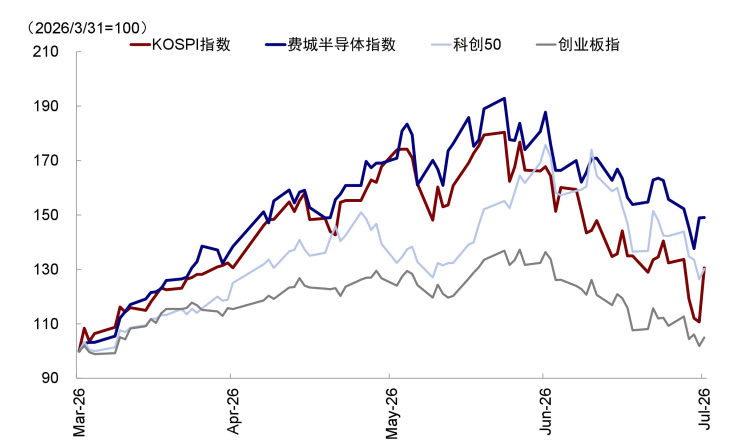
 Chart 2: Consumer and dividend-paying sectors have shown signs of recovery
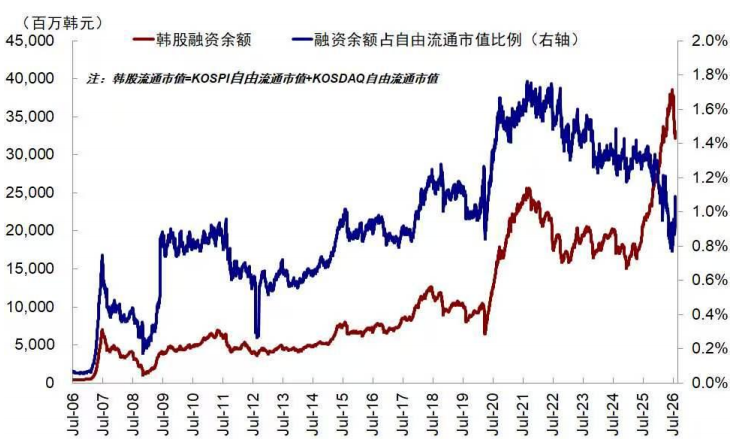
We believe that under the broad assumption that the AI industry trend has neither reached a bubble nor run its course, the recent pullback actually enhances the risk-reward profile (odds) of AI-related investments from a medium- to long-term perspective. However, for markets to quickly break above previous highs and re-attract capital, new use cases and demand breakthroughs are needed to lift the 'ceiling' (win rate)—similar to Anthropic’s coding breakthrough in Q1 2024, which catalyzed the prior rally in AI-related assets (Chart 3). After all, the previous highs were supported by substantial leveraged positions, as exemplified by South Korea (Chart 4). Therefore, even though most investors still view AI technology as the primary investment theme, many may naturally consider a more balanced allocation following this period of sharp volatility.
Chart 3: Anthropic’s coding breakthrough in Q1 2024 catalyzed the upward move in AI-related assets
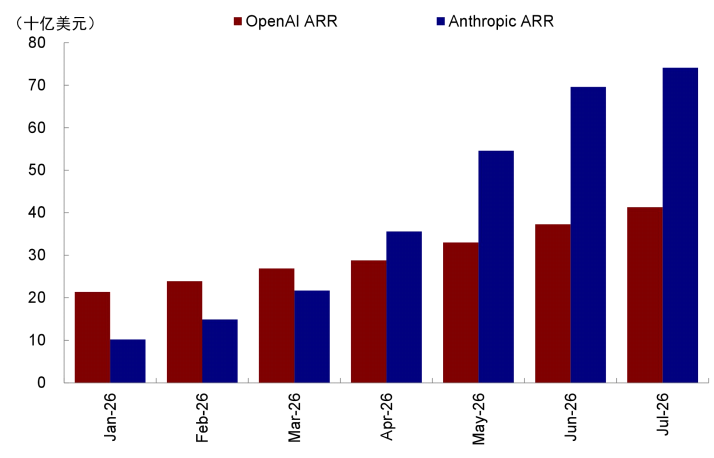
Chart 4: The market peak in June was driven by a large influx of leveraged capital
This raises the question: beyond the AI theme, what else is worth investing in? Previously, investors flocked to AI not because they were unaware of its crowded positioning and poor risk-reward ratio, but because its growth trajectory was exceptionally strong and its win rate extremely high. Conversely, they avoided consumer sectors not because they overlooked their attractive valuations and favorable risk-reward profiles, but because fundamentals were weak and win rates low. However, turbulence in the tech sector erodes the appeal of high-win-rate assets, necessitating higher compensation in the form of improved odds. This also highlights the attractiveness of lower-volatility segments that may lack explosive growth but offer stability. In other words, allocations outside the AI theme during this phase primarily aim to capture valuation repair and provide volatility hedging; generating earnings-driven returns will still require catalysts that improve win rates.
Thus, the question 'What to buy beyond AI?' fundamentally reflects a shift in the market—from an extreme K-shaped divergence driven solely by win rate toward a more balanced approach that considers both win rate and payoff ratio, resulting in less pronounced differentiation. To address this, we answer three questions in this report: Where does the current AI correction stand, and how might it stabilize? What can improve the win rate for non-AI sectors? And what should investors do now?
We have constructed two models—one cross-sector and one cross-asset—that assess win rate (fundamental certainty) and payoff ratio (valuation-based upside potential). At the current juncture, these models indicate that the S&P 500, Nasdaq 100, Dow Jones, M7, U.S. Treasuries, ChiNext 50, and the following MSCI China sector indices—Insurance, Materials, Electrical Equipment, Innovative Pharmaceuticals, and Telecommunications—exhibit relatively high composite scores on a monthly basis for both win rate and payoff ratio, making them suitable as short-term balancing positions outside the AI theme. Backtesting shows that a monthly rebalancing strategy based on this model has consistently outperformed benchmark indices over the long term.
Where does the current correction stand? Deleveraging is entering its mid-to-late phase, macro headwinds await full exhaustion, and catalysts from industry developments remain pending.
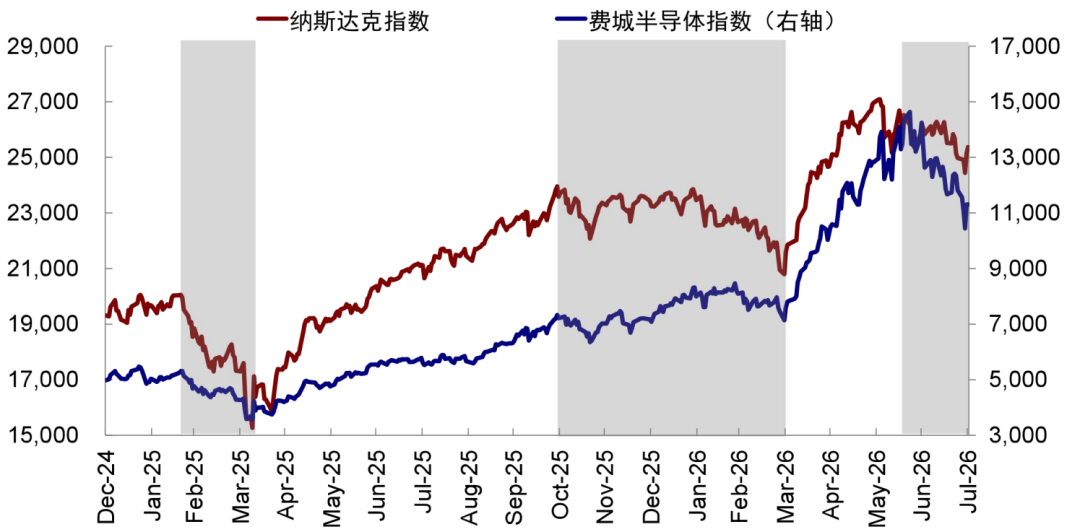
Looking back at the four major corrections during the five-year dot-com bubble period (see "How many times did the market decline before the dot-com bubble burst?") (Chart 5), as well as the three episodes of turbulence since the start of the current AI rally (early 2025: DeepSeek and retaliatory tariffs; late 2025 to early 2026: bubble concerns and Iran geopolitical tensions; and since June 2026—see Chart 6)—each instance without exception resulted from a confluence of three factors: micro-level excessive valuations and crowding, macro-level external shocks (e.g., Fed rate hikes, Asian financial crisis, LTCM losses, retaliatory tariffs, Iran tensions), and bottlenecks in industrial development (concerns over oversupply, falling DRAM prices, overinvestment, cash flow pressures, etc.). Conversely, market stabilization—and even subsequent new highs—has historically coincided with relief across these three dimensions, as evidenced by the recoveries following each of the four dot-com bubble pullbacks.
Chart 5: Between 1995 and 1999, the Nasdaq Composite Index experienced four notably significant drawdowns.
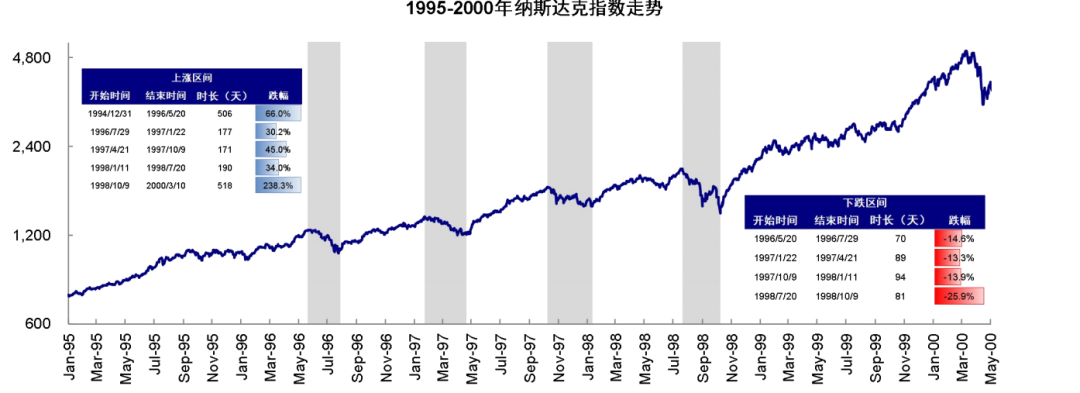
Chart 6: The three episodes of turbulence since the onset of the current AI rally have similarly stemmed from micro-level high valuations and crowding, macro-level external disruptions, and industrial bottlenecks.
At this point, we believe that: 1) deleveraging and the resolution of positioning crowding have progressed into the mid-to-late stage; 2) macro concerns regarding the Fed’s potential rate cuts have not yet been fully priced out—should the Fed hike rates in September, it could signal the exhaustion of negative sentiment (analogous to the 1997 'insurance-rate hike'); and 3) industrial developments are even more critical, requiring new use cases and demand catalysts to unlock fresh growth potential (see "How Can an 'Insurance-Rate Hike' Be Implemented?)。Specifically,
► First, valuation and crowding have declined to levels indicating the market is now in the latter half of the adjustment phase. Since late June, crowding percentiles for the Philadelphia Semiconductor Index, Nasdaq 100, and Korean equities have notably decreased (Exhibit 7);
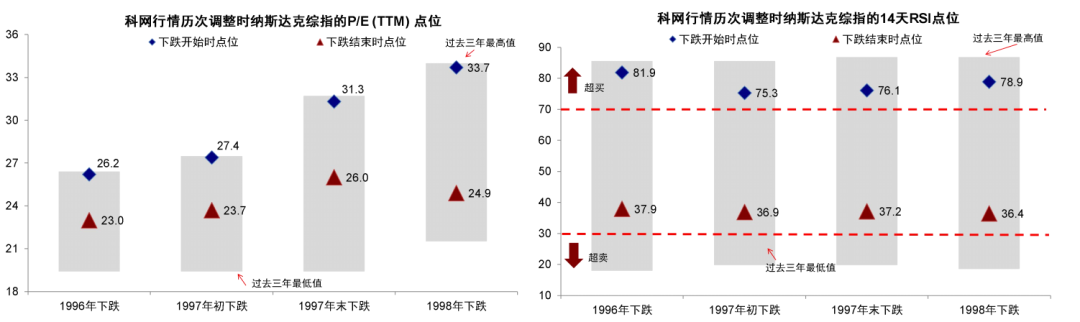
In terms of valuation, the Nasdaq Composite’s forward P/E ratio has declined to approximately 22.1x, representing a roughly 20% contraction from its year-to-date peak;
On sentiment, the Nasdaq’s 14-day RSI briefly dropped to 33, while Korea also entered oversold territory. Historically, during the four previous tech-sector corrections, the Nasdaq consistently reached oversold levels and valuations retreated to the 60th percentile; current sentiment appears to be in the latter half of the digestion phase (Exhibit 8).
Exhibit 7: The previously high crowding issue has significantly eased following phased adjustments
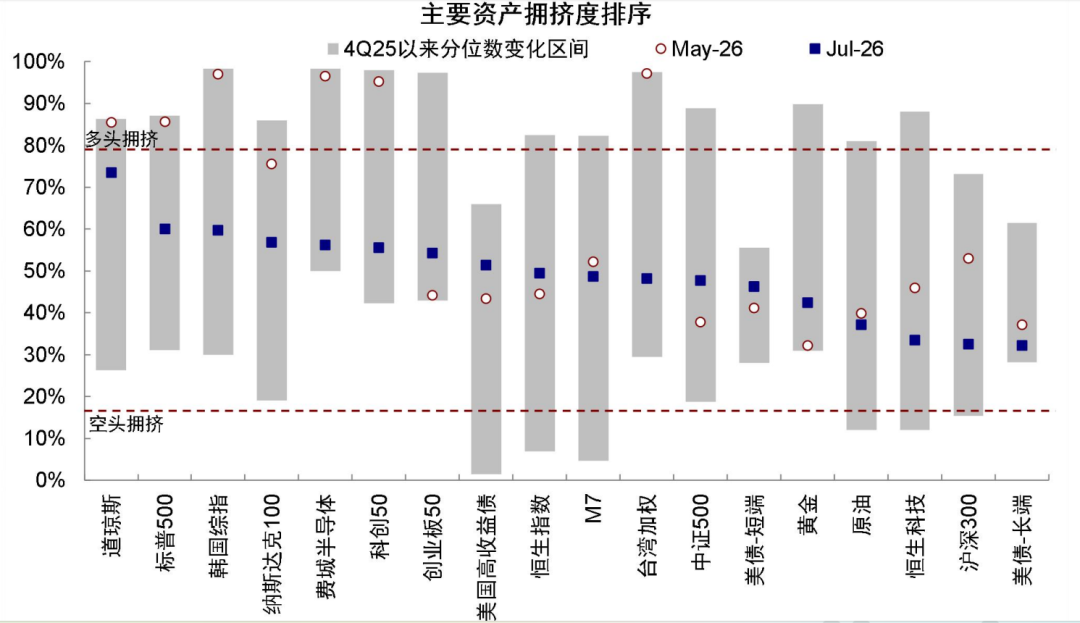
Exhibit 8: Historical review of past tech-sector corrections
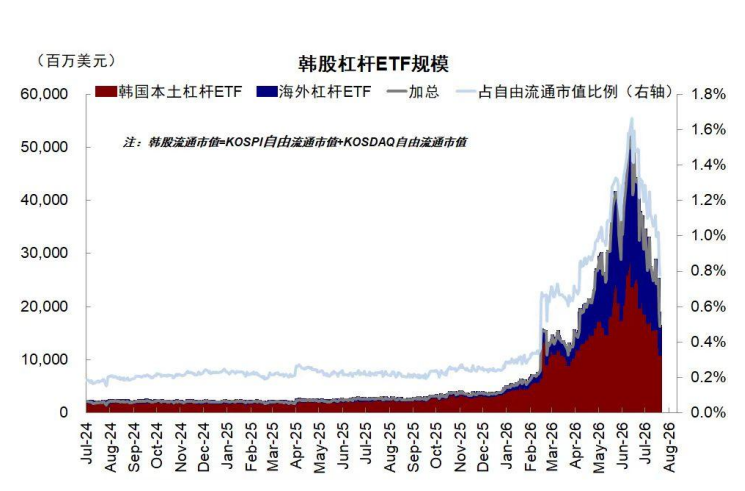
The steepest phase of deleveraging may already be behind us. Prior to the correction, retail investors accounted for over 70% of trading volume in the Korean equity market, and margin debt approached KRW 39 trillion, placing it at the 99.9th percentile. During the downturn, margin calls, rebalancing of leveraged ETFs, and negative gamma hedging by options market makers created nonlinear self-reinforcing dynamics that amplified losses several-fold ("How significant is leverage risk in Korean equities?As of now, deleveraging has already passed its halfway point: the combined scale of broker margin loans and leveraged ETFs has declined from a peak of KRW 120.6 trillion to KRW 55.7 trillion, representing a 54% contraction. Specifically, broker margin loans fell by 17% from KRW 38.6 trillion to KRW 32.2 trillion, while leveraged ETF assets plummeted by 71% from KRW 82.0 trillion to KRW 23.5 trillion (Exhibit 9). However, this self-driven deleveraging process is slow and vulnerable to external shocks; policy intervention could stabilize conditions more swiftly.
Exhibit 9: Significant decline in Korean equity leveraged ETF assets
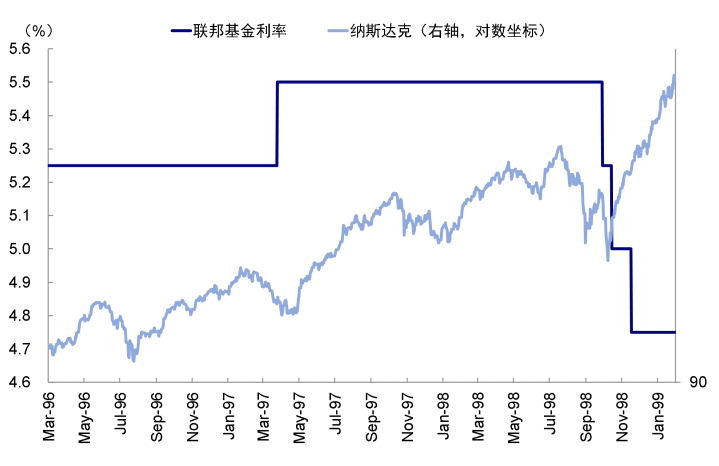
► Second, concerns over Fed tightening have not been fully dispelled; a rate hike in September could mark the exhaustion of negative sentiment. Although the July FOMC meeting did not deliver a rate hike, Waller’s ambiguous communication left markets uncertain—not only failing to fully alleviate fears of further hikes but also raising concerns about persistently high long-end U.S. Treasury yields due to potential long-term inflation失控. Looking ahead, if inflation were to weaken significantly, pressure would naturally ease. Otherwise, a September rate hike would be preferable to restore credibility (《How Can an 'Insurance-Rate Hike' Be Implemented?》). A rate hike is not inherently alarming—the Fed conducted a 'preemptive rate hike' in 1997 as well, which triggered an adjustment in U.S. equities (Exhibit 10). At that time, strong economic growth—not runaway inflation—was the backdrop, and the underlying sectoral trends were similarly supportive. After the hike materialized, U.S. Treasury yields peaked and began to decline, while equities gradually bottomed out. Thus, if the September decision is finalized, market volatility may also subside accordingly.
Exhibit 10: U.S. equities corrected by 13% from January 1997 amid rising rate hike expectations, but began rebounding one week after the hike was implemented
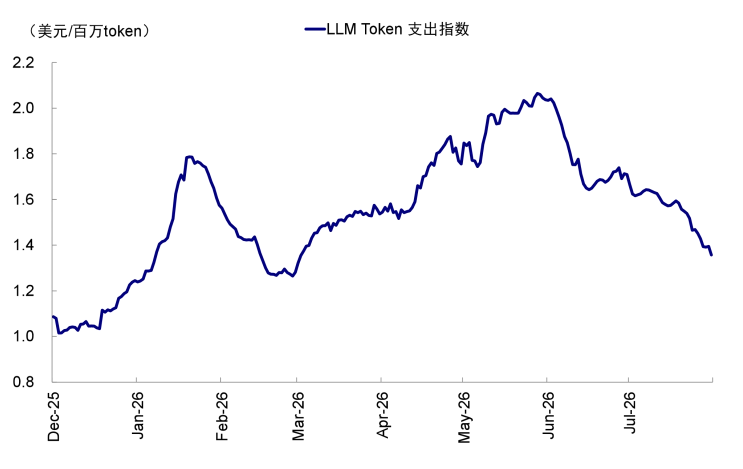
► Finally, new catalysts tied to industry trends are most critical—and we must await further observation. By 'new catalyst,' we mean incremental developments capable of systematically lifting forward-looking industry expectations, akin to Anthropic’s breakthrough progress in coding earlier this year, rather than mere confirmations of existing trends. Judged by this standard, no such catalyst has emerged yet. In programming-related businesses—where expectations have already been largely priced in (Exhibits 11–12)—revenue realization has been rapid (Exhibit 13). However, markets may currently worry that high token costs render AI-driven labor substitution economically unviable, potentially slowing revenue growth (e.g., token expenditure deceleration, Exhibit 14), which in turn fuels concerns about the sustainability of large-scale capex. In our report 《How to Monitor the AI Bubble?》, we established a monitoring framework comprising 20 indicators across four dimensions: demand, cash flow, funding sources, and external constraints. The current issue lies not in weakening demand per se, but at the second layer—cash flow. For instance, Google’s latest earnings showed its free cash flow turned negative for the first time. Hence, unlocking new use cases and demand sources to break through the existing demand 'ceiling' is crucial, as it would help alleviate static concerns about excessive investment.
Exhibit 11: Theoretical vs. actual exposure of AI across different sectors
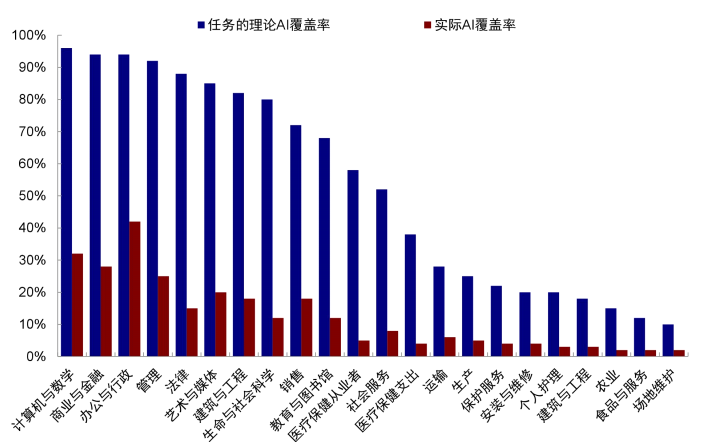
Exhibit 12: Current AI-driven substitution effects on wages and employment levels
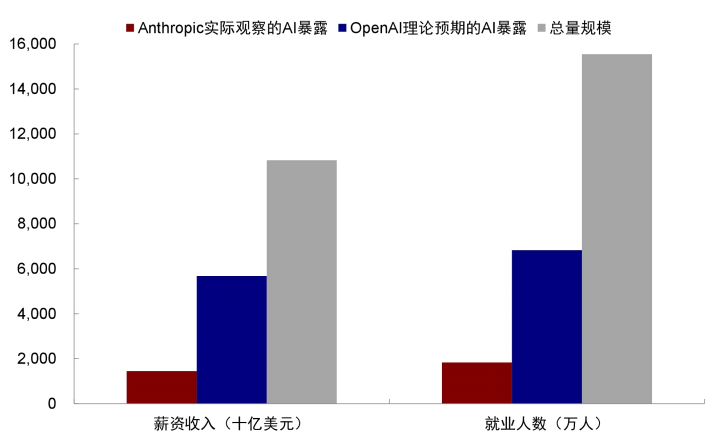
Exhibit 13: Anthropic’s Annual Recurring Revenue (ARR) has been rapidly realized year-to-date
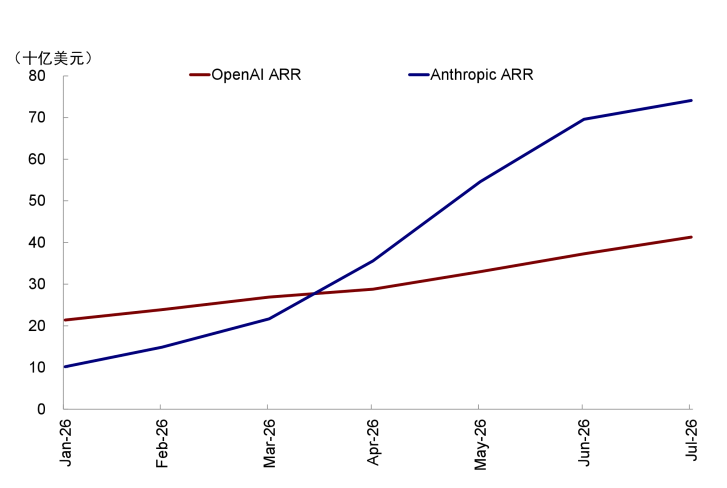
Exhibit 14: In the near term, the market may be concerned that high token costs could render AI-driven labor substitution economically unviable, thereby slowing revenue growth
Overall, among the three conditions—position crowding, leverage unwinding, and policy catalysts—crowding and deleveraging have progressed into their mid-to-late stages, and the Fed’s September headwinds appear largely priced in. However, tangible industry catalysts have yet to emerge. As such, the AI sector still offers a high probability of success, though near-term sentiment may remain conflicted. The market is likely entering a phase of consolidation or modest recovery, with capital reallocating from broad-based gains toward leading names demonstrating clear earnings visibility. Without fresh industry catalysts, a swift rebound in broad indices to previous highs remains challenging, given that the prior rally was largely driven by leverage and sentiment. Oversold high-quality individual stocks may see some recovery, but those primarily driven by speculative flows will likely require more time. At this juncture, in addition to maintaining exposure to attractively valued, high-quality AI leaders, some investors may shift from a pure focus on high-probability outcomes toward a more balanced approach, rotating into higher-upside opportunities supported by emerging fundamental confirmation.
Can the rebound in non-AI sectors be sustained? Valuations are attractive, but fundamental outlooks differ.
Against the backdrop of recent AI sector adjustments, non-AI segments—particularly consumer staples, dividend-paying stocks, and Hong Kong-listed tech names such as the Hang Seng Tech Index—have seen notable rebounds. Since late June, the CSI Consumer Index, Hang Seng Tech Index, and CSI Dividend Index have risen by 13.9%, 13.5%, and 9.5%, respectively. This is driven by two main factors: first, portfolio rebalancing as capital seeks alternatives after exiting the overcrowded AI trade; second, attractive valuations—non-core sectors are trading at low valuation and position levels, offering favorable risk-reward ratios. Mainland mutual funds’ Hong Kong equity holdings as of Q2 have even reverted to levels seen before the 'September 24' policy shift, with positions in internet giants like Tencent and Alibaba falling to historic lows—a clear reflection of this trend ("How Much Hong Kong Equity Do Mutual Funds Still Hold? Q2 2026 Mutual Fund Holdings Analysis》)。
Looking ahead, however, rebounds driven solely by attractive valuations have limited room and sustainability. Further upside will require support from fundamentals—that is, improved probability of success ('win rate'). The fundamental recovery prospects vary across sectors:
► For consumption and domestic demand sectors, a sustained, directional rally hinges on whether fiscal policy can deliver significant stimulus tilted toward consumption (a 'September 24'-style intervention). The July Politburo meeting did not provide the strong stimulus the market had hoped for. It mentioned 'timely formulation and implementation of practical and effective incremental policies,' emphasized 'strengthening countercyclical adjustment,' and proposed 'optimizing coordinated fiscal and monetary policies to boost domestic demand' and 'unlocking the potential of services consumption.' Compared with the six Central Politburo meetings since September 24, 2024, the current policy push appears weaker than those following the September 26, 2024 meeting and the April 2025 meeting after reciprocal tariff actions (Exhibit 15). Thus, the focus remains on better utilizing existing policy tools, albeit with accelerated implementation relative to Q2. Under this scenario, fiscal or domestic demand conditions may show marginal improvement in Q3, but likely not enough to drive broad-based win-rate recovery.
Exhibit 15: Comparison of Six Central Politburo Meetings

► Cyclical and export-oriented sectors benefit from overseas demand, facing relatively fewer domestic headwinds. Innovative pharmaceuticals and certain cyclical industries fall under this 'broad export-demand' category. In our medium-term outlook, we noted that from the perspective of credit cycle recovery, the U.S. may find it easier than China in the near term: deeper AI investment, declining U.S. Treasury yields, and additional overseas fiscal spending could all catalyze credit expansion—and none depend on the pace of domestic Chinese policy ("Hong Kong Market Outlook for H2 2026: Is the Party Over There?"). If U.S. Treasury yields decline further and overseas fundamentals materialize, the win rate for export- and cyclical-oriented sectors should improve more smoothly—though timing remains uncertain, and current positioning is still somewhat early-cycle.
► For internet stocks, the catalyst for improving win rates would be a 'DeepSeek moment'—a significant breakthrough in AI applications. Currently, the AI narrative is largely confined to hardware; in the application layer, major listed internet companies—key index constituents—lag behind unlisted large-model developers in AI-related business progress. Thus, the internet sector’s rally remains primarily valuation-driven, and its sustainability depends on internal catalysts such as increased investment and revenue growth.
Therefore, in terms of the sequence for repairing win rates, sectors with broad exposure to external demand—such as cyclicals, innovative pharmaceuticals, and internet stocks—face relatively less resistance, whereas consumer-related sectors lag behind. Consequently, balanced portfolio allocation should tilt toward areas with lower resistance and slightly higher win rates. For the Hong Kong equity market as a whole, given its significant exposure to consumer and internet sectors, a sustained broad-based rebound would similarly require a catalyst akin to the 'September 24 moment' or a 'DeepSeek moment.'
How should investors position themselves now? Shift from focusing solely on win rate to balancing both win rate and payoff ratio.
As previously discussed, in a market characterized by extreme volatility and overcrowding, strategies that either exclusively 'crowd into leading themes' or 'bet on high-to-low rotations' each have notable shortcomings. A more viable approach is to implement balanced portfolio construction and management by integrating both win rate and payoff ratio considerations.
To this end, we calculate both win rate and payoff ratio for each sector within the MSCI China Index. Win rate reflects the probability of upward performance over the coming period, while payoff ratio captures the asymmetry between potential upside and downside. Based on this 'win rate–payoff ratio' framework, we establish a sector scoring system:
► Win Rate–Payoff Ratio Framework: Win rate comprises two components—earnings expectations and micro liquidity—while payoff ratio is measured by valuation. Within win rate, earnings expectations are assessed using cross-sectional percentiles of FactSet-consensus forward EPS year-over-year growth and changes in forward ROE YoY across sectors. Micro liquidity gauges a sector’s own trading strength through three indicators: one-year momentum, one-year volatility reversal, and price-volume elasticity. The weights assigned to each component and indicator are dynamically determined each month based on ICIR (Information Coefficient to Information Ratio). Payoff ratio is derived by taking the inverse of the 5-year rolling percentile for each sector’s PE, PB, and PS ratios, then averaging them equally. This approach is grounded in the mean-reversion property of valuations: cheapness itself constitutes a key source of upside potential.
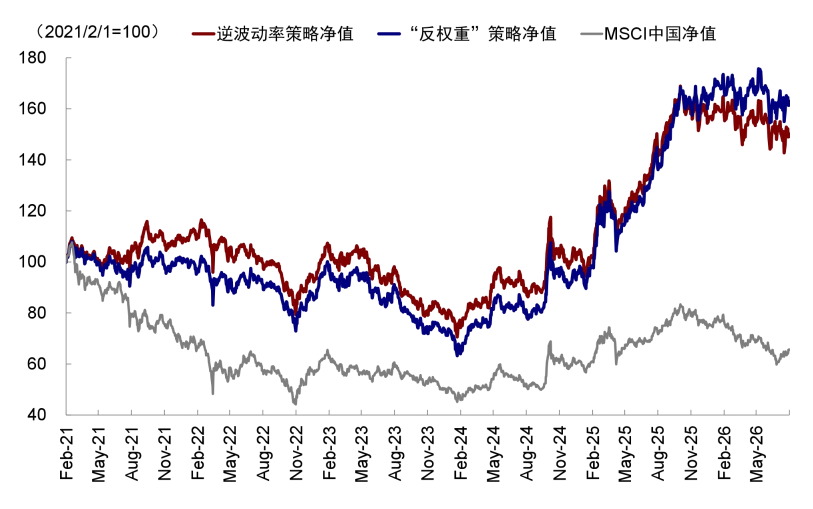
► Strategy Construction: We select the top five sectors based on composite scores (80% win rate + 20% payoff ratio) to form a long-only portfolio, rebalanced monthly. Sector weights are assigned inversely proportional to their volatility. Backtesting shows this approach effectively outperforms the benchmark. The 80/20 weighting between win rate and payoff ratio was calibrated using data from February 2021 to June 2025, and out-of-sample performance over the past year has also been robust. In the benchmark strategy, inverse-volatility weighting is applied because the composite score emphasizes win rate; sectors with extremely high win rates are often in a consensus-driven phase of rising volatility and upward momentum, making them prone to sharp drawdowns upon any disruption—as recently seen in the AI hardware sector. Deliberately reducing exposure to such high-volatility, high-consensus names improves the portfolio’s long-term performance. Alternatively, an 'inverse-score weighting' scheme can be used as a variant—where higher-scoring sectors receive lower weights—which also delivers strong backtested results. However, inverse-volatility weighting remains the most widely adopted baseline methodology, while inverse-score weighting is more exploratory in nature and offered here for investor reference (Exhibit 16).
Exhibit 16: Our sector allocation strategy, based on the 'win rate–payoff ratio' framework, effectively outperforms the benchmark
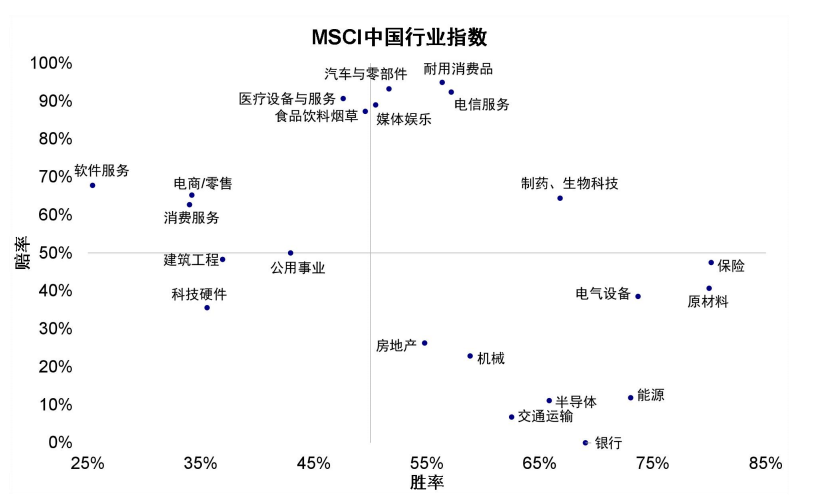
As of the end of July 2026, the model’s top-ranked sectors are: insurance, materials, electrical equipment, innovative pharmaceuticals, and telecommunications (Exhibit 17). This largely aligns with our earlier qualitative assessment: materials represent an early-cycle positioning in cyclicals, while innovative pharmaceuticals and electrical equipment benefit from external demand.
Exhibit 17: Win-Rate and Odds of MSCI China Sector Indices as of July 31, 2026
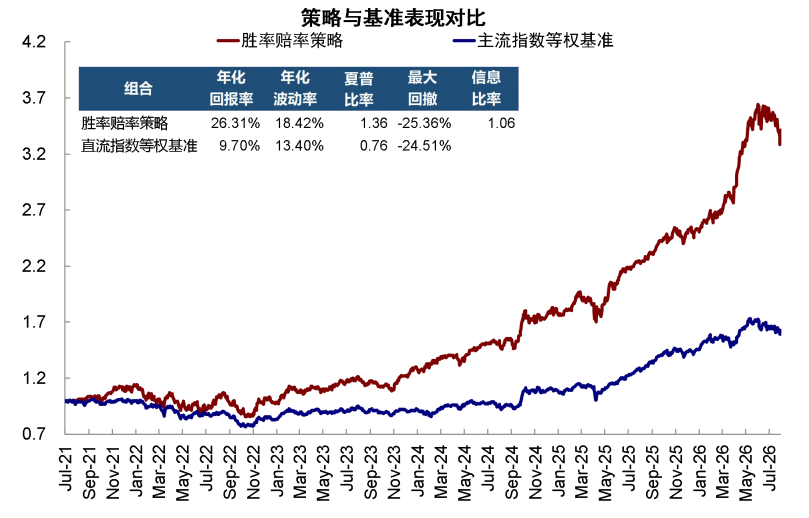
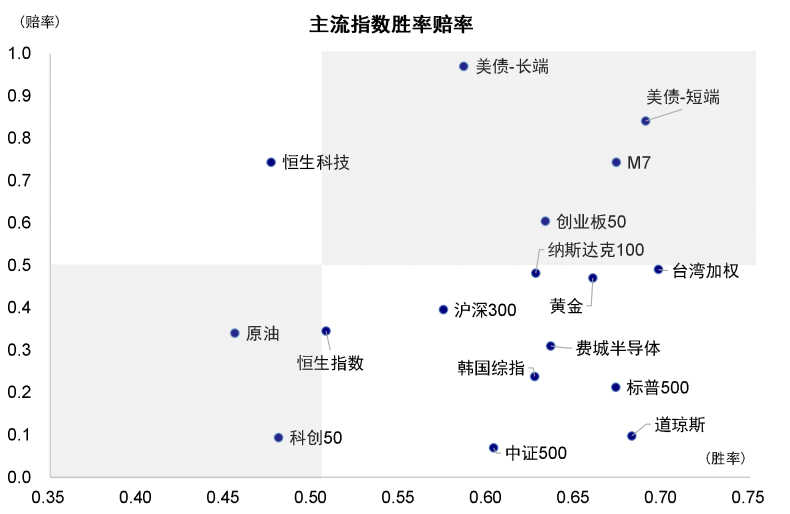
Similarly, we have also constructed a cross-asset win-rate and odds model. We use liquidity to assess the 'denominator win-rate,' earnings forecasts to assess the 'numerator win-rate,' and valuation to determine asset odds. Finally, we combine these three signals—assigning a 67% weight to win-rate and 33% to odds—to balance non-liquidity premium, improving earnings expectations, and attractive valuations. The portfolio is rebalanced monthly, selecting the top five (or tied for top five) assets by score. For details on indicator specifications and coverage of major indices, see “How to manage highly crowded assets?”. Strategy backtesting shows that from July 2021 to the end of July 2026—a five-year period—the win-rate and odds strategy applied to major indices delivered an annualized return of 26%, outperforming an equal-weighted benchmark portfolio by approximately 17 percentage points per year. The strategy exhibited an annualized volatility of 18.4% and a Sharpe ratio of 1.4, both superior to the benchmark. Its information ratio was 1.1, indicating higher excess returns per unit of volatility (Exhibit 18). According to the latest model update as of the end of July, top-scoring assets include the S&P 500, Nasdaq 100, Dow Jones, M7, long-end U.S. Treasuries, and ChiNext 50.
Exhibit 18: A Major Index Strategy Based on Win-Rate and Odds Significantly Outperforms an Equal-Weighted Benchmark
It should be noted that the aforementioned cross-sector weighting of 80% win-rate and 20% odds, and the cross-asset weighting of 67% win-rate and 33% odds, represent our baseline scenario only. Investors with different preferences may adopt alternative weightings: long-term investors who prioritize certainty may increase the win-rate weight (e.g., 90/10) and downplay short-term volatility, typically favoring fundamentally solid and widely recognized assets; more tactical investors may increase the odds weight (e.g., 50/50 or even 30/70), favoring areas such as consumer and Hang Seng Tech, which currently exhibit both low valuations and low positioning and offer potential for valuation repair.
Exhibit 19: Win-Rate and Odds of Major Indices as of July 31, 2026
Want to select stocks or get a stock diagnosis? Curious about the opportunities and risks in your portfolio? For all your investment questions,Just ask Futubull AI!

Edited by Joryn