More updates to follow.
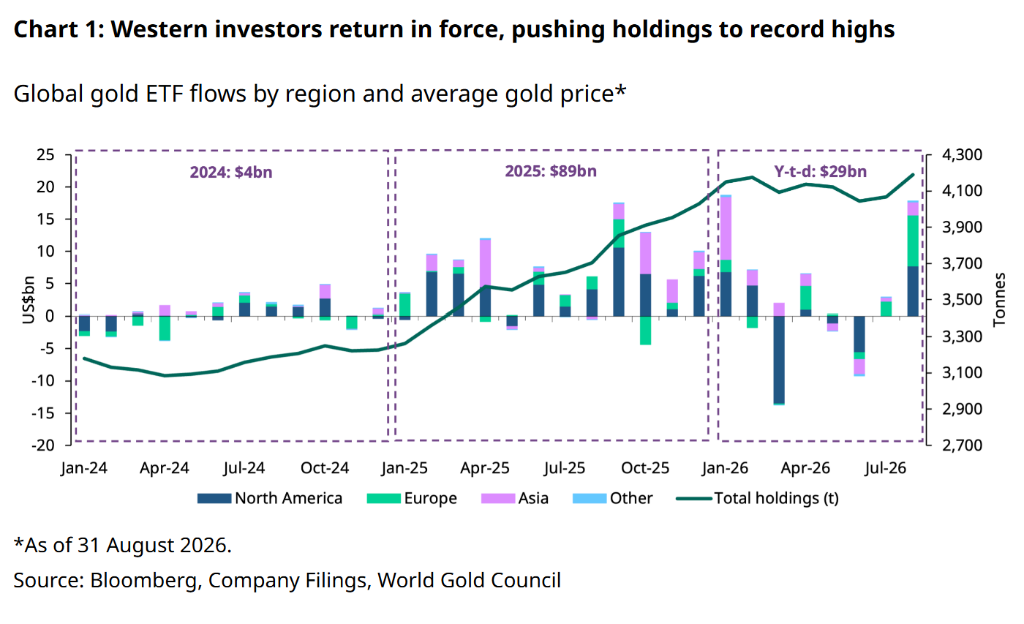
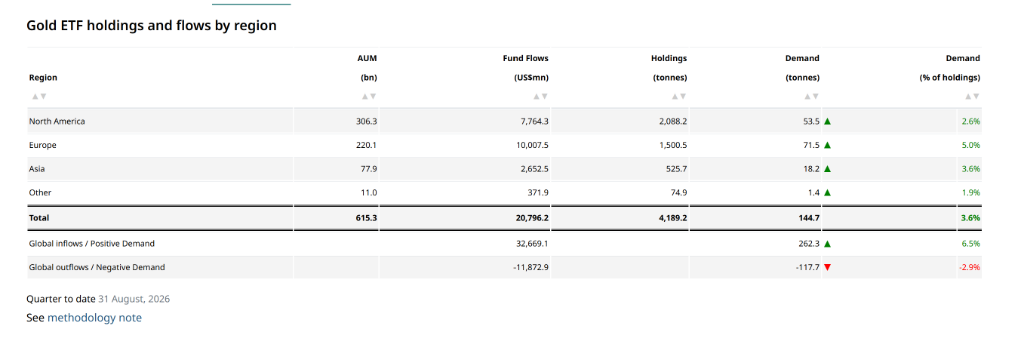
The global gold ETF market recorded historically strong performance in August 2026, with inflows surging to the second-highest level on record and driving total holdings to surpass previous peaks for the first time. The robust return of Western investors served as the core driver of this rally.
According to a report released by the World Gold Council on September 9, global gold ETFs saw net inflows of $18 billion in August. Total assets under management (AUM) rose sharply by 16% month-on-month to $615 billion, while holdings increased by 121 tonnes to reach a record high of 4,189 tonnes. North America and Europe together accounted for approximately 90% of global inflows, with Europe posting its strongest monthly performance on record and North America recording its third-largest monthly inflow in history.
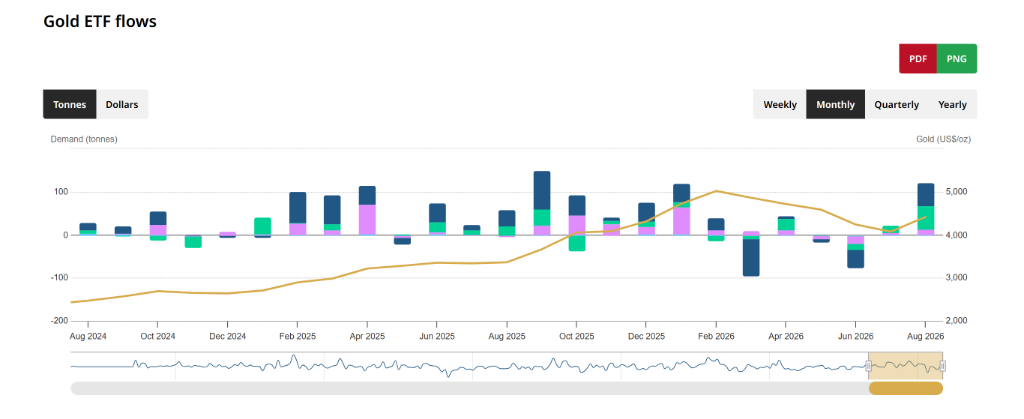
 Behind this surge in capital flows, multiple macroeconomic factors converged to drive demand. The report highlights that policy concerns triggered by U.S. intervention in foreign exchange markets to support the yen, ongoing fiscal sustainability worries amid pressure in the U.S. Treasury market, and renewed fears of U.S. dollar depreciation collectively accelerated investor allocation to gold. Meanwhile, gold prices breaking through key technical levels further strengthened market momentum, attracting more tactical and institutional capital.
Europe Leads, North America Accelerates Catch-up
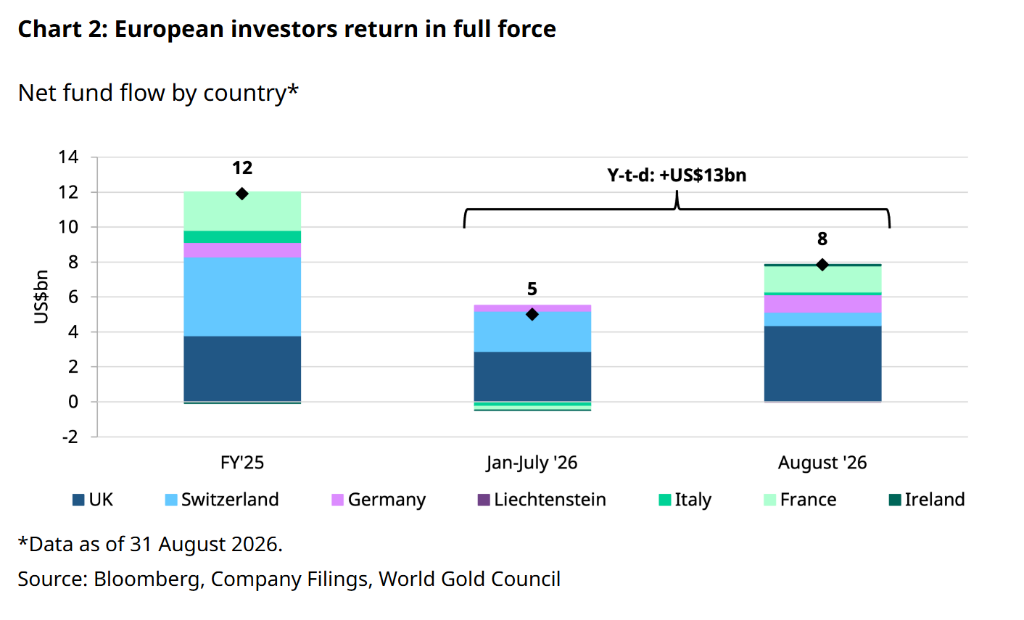
European gold ETFs attracted $7.9 billion in inflows in August, marking the region's strongest monthly performance on record. The World Gold Council report notes that, in addition to fiscal sustainability concerns shared with the North American market, European investors continue to face pressure from high sovereign debt borrowing costs, underscoring gold's growing role as a portfolio diversification tool and an alternative to sovereign bonds. The report also specifically points out that strong buying persisted following the July rebound, indicating that investors viewed the summer pullback as an entry opportunity to rebuild strategic positions.
Within Europe, the United Kingdom led with $4.4 billion in monthly inflows, setting its second-highest monthly record in history; France contributed $1.5 billion, also refreshing its own highest monthly record, demonstrating the breadth of demand among European investors.
North American gold ETFs recorded net inflows of $7.7 billion in August, the region's third-largest monthly inflow on record. Notably, the pace of inflows was markedly slower at the beginning of the month and accelerated later—starting relatively mildly before surging during the week of August 17, when approximately $4 billion flowed in over just five trading days, accounting for more than half of the month's total. This timing closely coincided with the U.S. Treasury Department's intervention in the U.S. Treasury market on August 19. The strong inflows in August effectively offset the record $13 billion net outflow in March, returning year-to-date fund flows in the North American region to positive territory.
Asia Contributes Steadily, Leading Globally Year-to-Date
Asian gold ETFs recorded net inflows of $2 billion in August, their strongest monthly performance since February. China continued to dominate regional inflows, with stabilizing and recovering gold prices boosting investor interest and supporting allocation demand. India and Japan also posted moderate net inflows.
Cumulative data from the beginning of the year shows that total global gold ETF inflows reached $29 billion, with holdings increasing by 160 tonnes. Listed funds in Asia remained the largest source of global inflows during this period, followed by Europe.
Gold ETFs in other regions recorded total inflows of $234 million in August, with Australia contributing $190 million, accounting for the vast majority of inflows in the region.
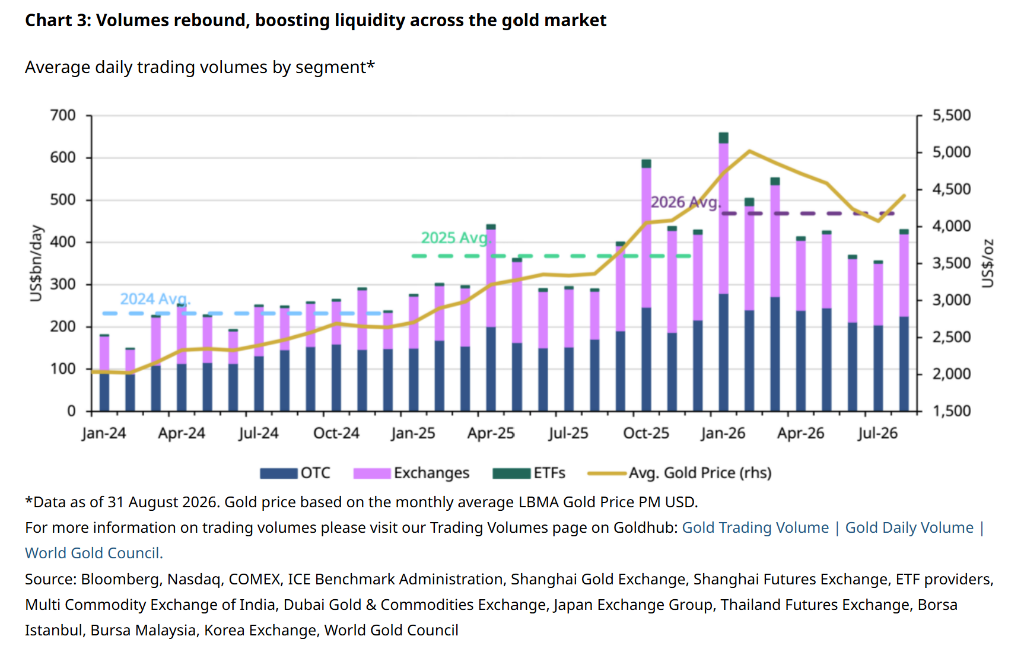
Trading volumes rebounded across the board, and market liquidity improved significantly.
Overall activity in the gold market surged in August. According to data from the World Gold Council, the average daily trading volume in the global gold market increased by 21% month-on-month to $430 billion, with growth recorded across all major market segments.
Over-the-counter (OTC) trading(OTC) average daily trading volume rose 10% month-on-month to $226 billion, while London Bullion Market Association (LBMA) activity increased 11% month-on-month to $199 billion, significantly exceeding the full-year 2025 average. Liquidity in exchange-traded gold derivatives jumped sharply, with average daily trading volume rising 33% month-on-month to $195 billion; COMEX gold derivatives grew by 28%, and the ShanghaiFutures TradingExchange saw a 48% increase. Average daily trading volume in gold ETFs surged 83% month-on-month to $870 million, with North American listed funds contributing over 73% of ETF trading volume.
In terms of positioning, net long positions in COMEX gold increased substantially by 212 tonnes (+39%) in August, reaching 753 tonnes. Among these, managed money net longs rose by 96 tonnes to 470 tonnes, surpassing the previous year-to-date peak of 443 tonnes; other reportable positions saw net longs increase by 115 tonnes to 283 tonnes. Net open interest in COMEX gold options hit a two-year high at the end of July, and although it declined slightly in August, it remained significantly higher than levels in January and February, indicating that bullish bets on gold continue to accumulate.