
Whether the Federal Reserve should raise interest rates has been the most divisive, volatile, and contentious issue in the market over the past month. Waller's "ambiguous" remarks at the late-July FOMC meeting regarding inflation targets and the reflexivity of market rates marked the starting point of the U.S. Treasury "storm." Even direct buybacks of Treasury bonds by the U.S. Department of the Treasury failed to stabilize the situation. The core issue was not an unmanageable surge in bond supply, but rather concerns that the Federal Reserve could not provide the reassurance needed for investors to hold long-term U.S. Treasuries with confidence.
Chart 1: The U.S. Treasury term premium once climbed from 0.65% in late July to 0.90% in mid-August.
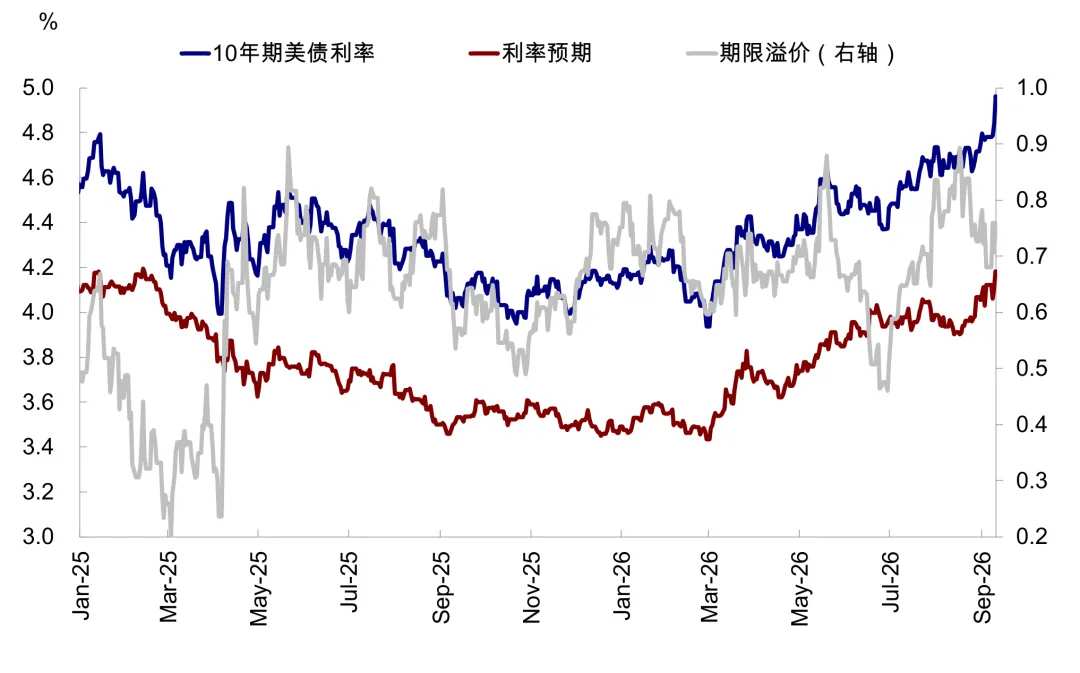
From that moment on, the decision to raise interest rates was no longer just a matter of inflation and the data itself. Consequently, Waller felt compelled to reiterate at the Jackson Hole symposium in late August that maintaining the 2% inflation target and combating inflation are the Federal Reserve's non-negotiable responsibilities—rather than allowing market interest rates to rise in a self-fulfilling manner. This hawkish rhetoric helped stabilize market expectations, indeed proving somewhat effective, as the term premium, which measures investors' willingness to hold long-term bonds, fell by 20 basis points from its peak. We have previously pointed out that, from the perspective of safeguarding the Fed's credibility, raising interest rates is the optimal choice, unless subsequent data consistently come in below expectations.
 However, the data did not cooperate. Subsequent releases, such as non-farm payrolls, PPI, and CPI, consistently exceeded expectations. The Federal Reserve indeed faced unfavorable circumstances, being gradually backed into a corner and forced to honor its hawkish commitments.
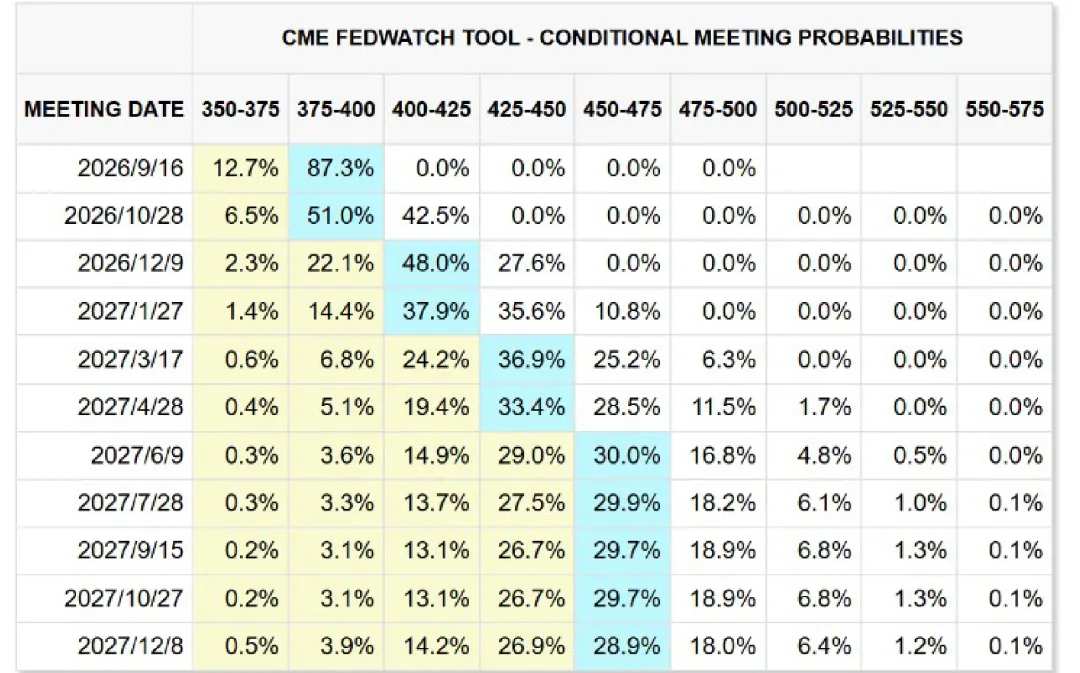
According to CME data, the market currently assigns a nearly 90% probability to a rate hike in September. The U.S. Treasury market is also pricing in a rate hike: since late August, the yield on the 2-year U.S. Treasury note has risen by 32 basis points from 4.34% to 4.66%. Currently, the 10-year U.S. Treasury yield stands at 4.96%; after deducting a term premium of 76 basis points, the remaining 4.18% reflects rate hike expectations. This is 60 basis points higher than the benchmark rate of 3.5%, implying expectations of more than two rate hikes.
Chart 2: Current market expectations assign a nearly 90% probability to a rate hike in September.
Therefore, the question has shifted from "whether to raise rates" to "what will happen after a rate hike." In our view, markets often avoid preparing for rate hikes due to fear of their impact beforehand, only to overreact to the post-hike shock once it becomes inevitable. We believe such excessive concern is unnecessary; the key lies not in the hike itself, but in the rationale behind it. So, will the Fed raise rates at this week's meeting? What will happen afterward? And what are the implications for asset allocation?
Will there be a rate hike in September? Fundamentals are ambiguous, but from the perspective of maintaining the Federal Reserve's credibility, a hike is preferable.
As a reference point, if Powell had made the same remarks at Jackson Hole, a September rate hike would have been almost certain. At the Jackson Hole symposium, Waller reiterated the 2% inflation target and emphasized that the Fed must fulfill its duty by focusing on price stability, adopting a notably stern tone. However, Waller is not Powell; his ambiguous style contrasts sharply with Powell’s approach. Waller believes that excessive market reliance on Fed guidance creates a "hall of mirrors" effect and does not advocate for full communication with the market, resulting in insufficient alignment with market expectations. Consequently, market expectations remain volatile. In early September, Waller’s dovish remarks temporarily dampened rate hike expectations. He pointed out signs of easing inflation, noting that energy prices had not yet spilled over into other price components, and argued that we should "give disinflation a chance."
From a fundamental perspective, the outlook remains ambiguous. Even though several data points, including inflation, exceeded expectations, one can still find evidence suggesting that underlying momentum is 'not that strong.'
1) Inflation: The rise in August data was mainly driven by factors such as oil prices, airfares, and hotel costs, which appear unlikely to persist. Our calculations suggest that, unless the central price of oil remains above $95 per barrel, the year-on-year CPI is highly likely to decline from the current level of 3.4% by year-end.
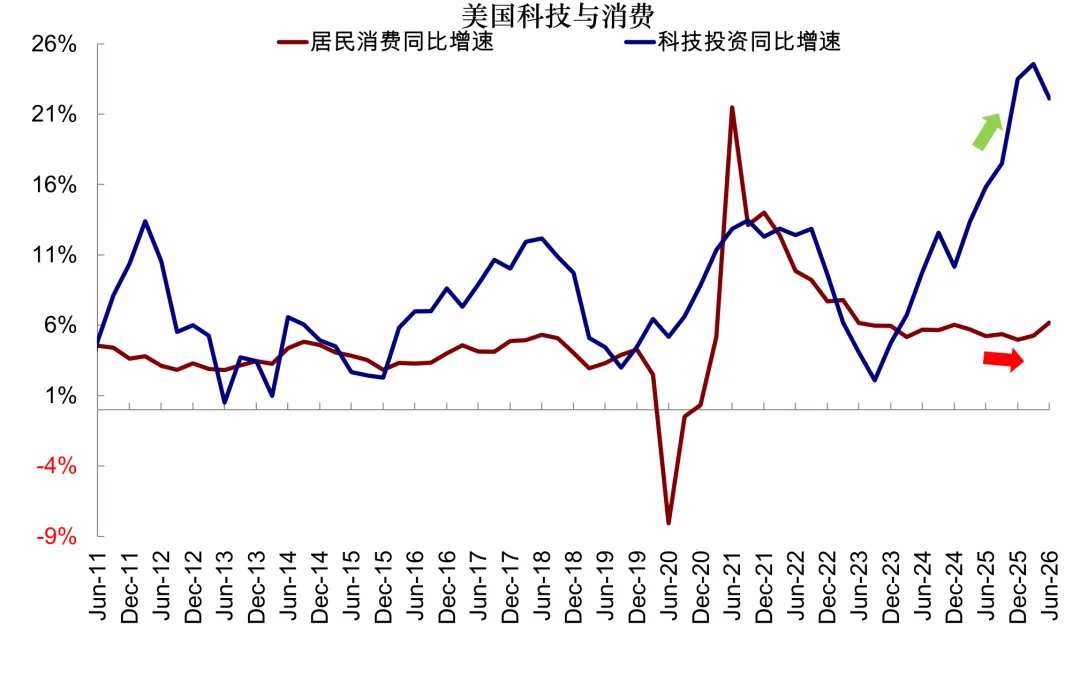
2) Growth: U.S. growth also exhibits a K-shaped pattern. Although the divergence is not as extreme, many traditional demand sectors are quickly bearing the pressure of high costs under such elevated interest rates, particularly real estate. Therefore, fundamental factors are not the decisive weight in the current equation.
Chart 3: U.S. growth is also K-shaped, albeit with less extreme divergence.
From the perspective of safeguarding the Federal Reserve's credibility, a rate hike is preferable; this is the key determinant. Waller's "deliberate ambiguity" at the July FOMC meeting threw market expectations into disarray, causing the U.S. Treasury term premium to rise from 0.65% in late July to 0.9% in mid-August, forcing Waller to make a hawkish commitment at Jackson Hole. If data weaken, the Fed likely still has room to maneuver. However, as non-farm payrolls and inflation data continue to exceed expectations, the Fed is gradually backed into a corner. Although these short-term indicators have limitations, they are the only data available ahead of the FOMC meeting. Consider this: if the committee were to "forcefully hold rates steady" again, how would the market interpret the previous hawkish statements? It would likely trigger a more severe crisis of confidence and a loss of control in the Treasury market.
What happens after a rate hike? Brief "preemptive rate hikes" often produce counterintuitive outcomes, representing a "sell the news" event where negative expectations are priced in.
The problem with the market is that it often avoids preparing for rate hikes beforehand due to fear of their impact, but then becomes overly concerned about the post-hike shock once the risk of a hike becomes inevitable.
When analyzing the impact of rate hikes, the rationale behind the hikes may be more important than the hikes themselves:
1) Sustained and significant rate hikes will inevitably cause longer-term and more substantial shocks to both real growth and financial markets by raising financing costs and tightening financial liquidity. The most typical example is the 16-month hiking cycle totaling 525 basis points initiated by the Fed after the outbreak of the Russia-Ukraine conflict in 2022, aimed at addressing supply-side inflation caused by pandemic-induced supply-demand mismatches and soaring oil prices.
2) Conversely, small or even preemptive rate hikes, due to their limited magnitude, cause limited disruption. In many cases, these expectations are priced in advance, so the actual implementation of the hike often signals that negative news has been fully absorbed. There are many 'classic cases' in history:
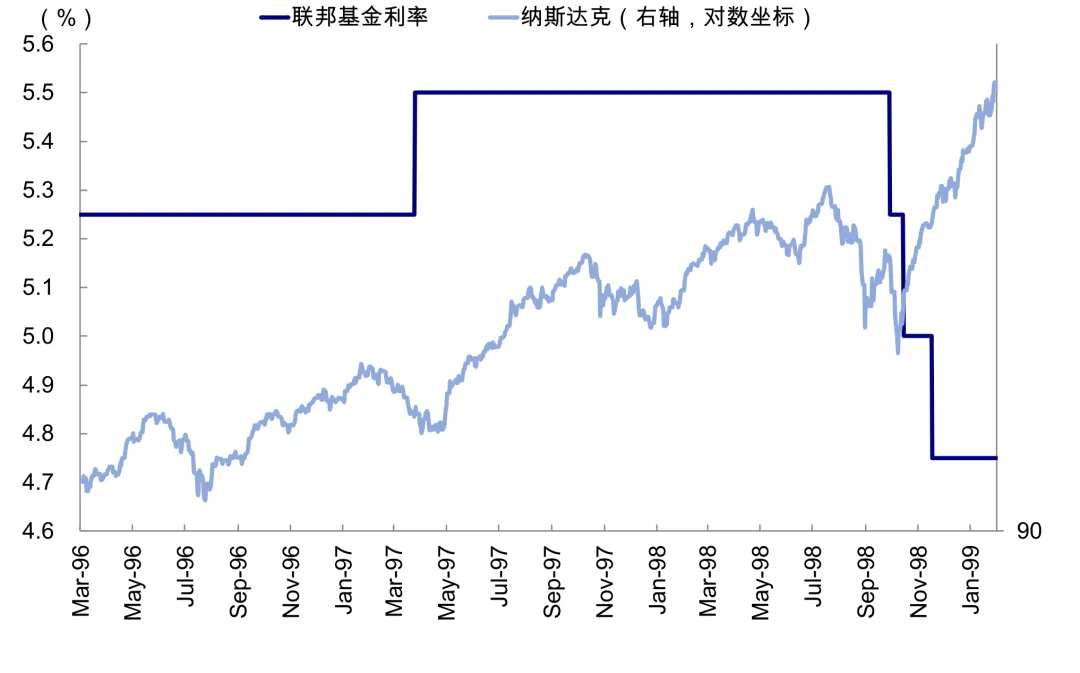
► If the rate hike is small or even 'preemptive': Since expectations are already priced in, the actual implementation of the hike may signal that negative news has been exhausted, which is not necessarily bad for the market; indeed, contrarian strategies often apply. A typical case is the 1997 rate hike: At that time, the U.S. environment was similar to today's, with inflation heating up but not yet out of control, financial conditions facing limited constraints, and economic growth remaining robust supported by technological trends. However, as the market had gradually priced in rate hike expectations before the FOMC meeting in March 1997, Treasury yields quickly peaked and declined after the policy announcement, and U.S. stocks resumed their upward trajectory within about a week.
Chart 4: U.S. Treasury yields touched a阶段性 high of 6.9% shortly after the 1997 rate hike was implemented.
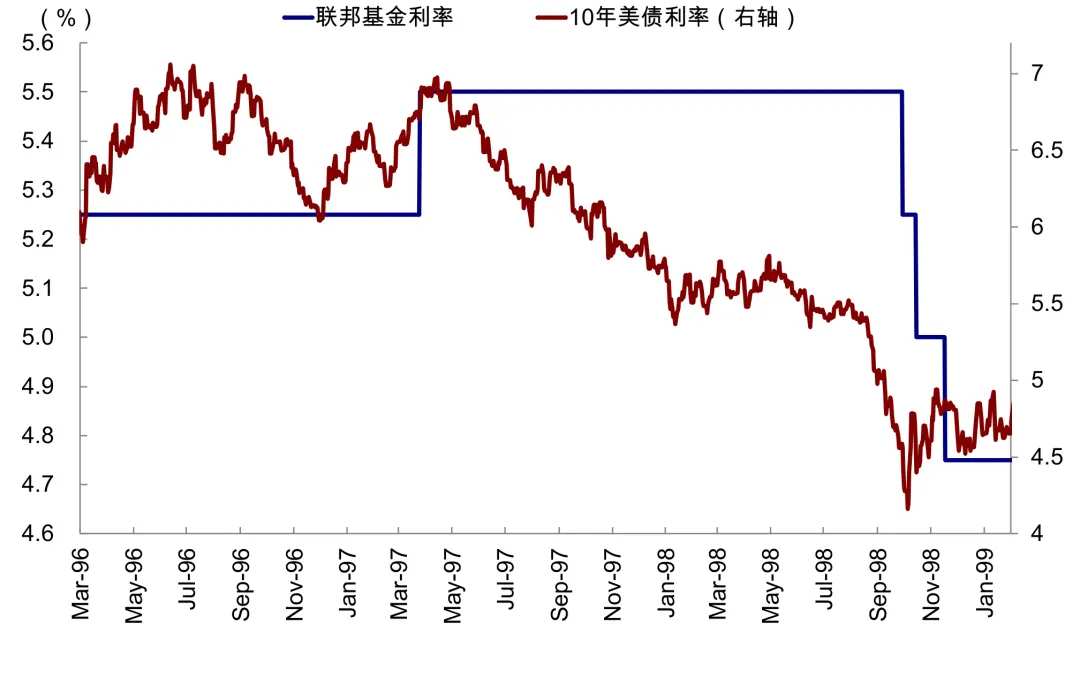
Chart 5: U.S. stocks began to rebound one week after the interest rate hike was implemented in 1997.
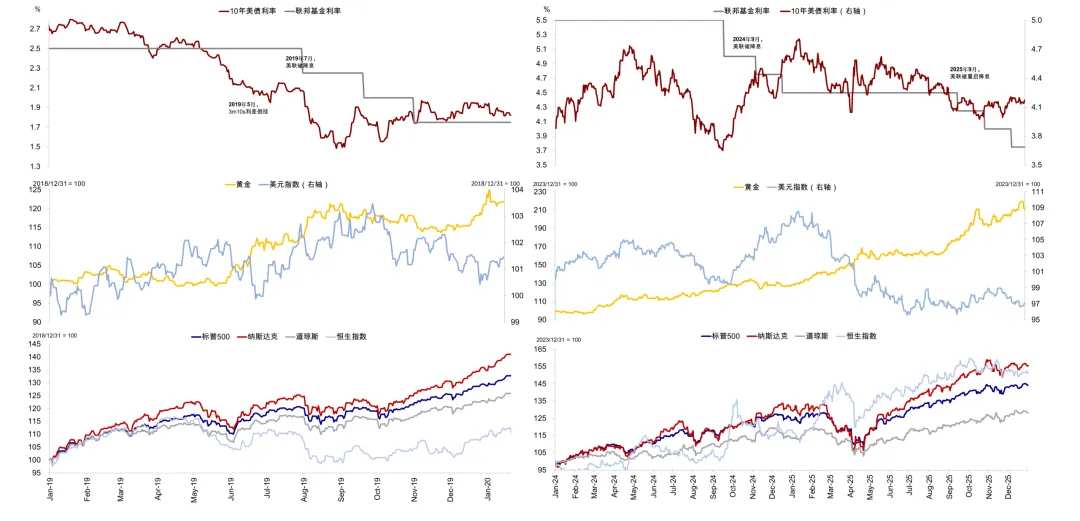
Conversely, a similar "script" played out during the "preemptive rate cuts" in 2019, 2024, and 2025. In these three rounds of rate cuts, although the economy faced certain downward pressures, there was no risk of a hard landing; thus, only minor policy adjustments were needed to provide support. As rate cut expectations are often priced in by the market in advance, once the cuts are implemented, the main trading narrative quickly shifts from "expectations of easing" to "improvements in growth." U.S. Treasury yields and the U.S. Dollar Index bottomed out and rebounded shortly after the rate cuts were implemented, showing the most sensitive reaction. Gold also performed better before the rate cuts than after, unless a grand narrative significantly pushed up gold prices, as seen in 2025. U.S. stocks waited for the rate cuts to transmit to the numerator (earnings), so they continued to rise somewhat after the cuts. Hong Kong stocks benefited to some extent from improvements in the denominator (discount rates), but domestic fundamentals remained the decisive factor; for instance, they surged temporarily after the rate cut in September 2025, which also marked the high point of this cycle.
Chart 6: During the "preemptive rate cuts" in 2019, 2024, and 2025, the main trading narrative shifted quickly from "expectations of easing" to "improvements in growth" after the rate cuts were implemented.
► If multiple rate hikes are required: The market adjustment is larger in magnitude and longer in duration, as typified by the tightening cycle of 2022–2023. Under the dual impact of pandemic-related supply chain disruptions and the Russia-Ukraine conflict, U.S. year-on-year CPI reached 7–8% in early 2022, exceeding 9% in June. At this point, monetary policy was clearly lagging behind the inflation curve ('falling behind the curve'), forcing the Fed to raise rates rapidly starting in March 2022 until July 2023, for a cumulative increase of 525 basis points.
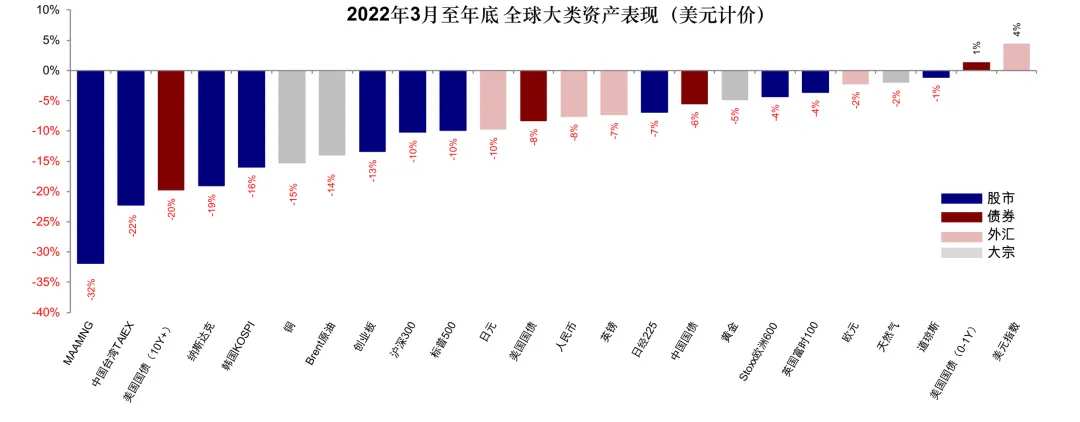
This round of tightening suppressed asset prices for a significantly longer period. The 10-year U.S. Treasury yield did not peak until October 2023, rising by 278 bp from the start of the hiking cycle; interest rate expectations peaked in March 2023, rising by 171 bp. The S&P 500 and gold bottomed out in October-November 2022, corresponding to the confirmation of the U.S. inflation turning point, with declines of 18% and 16%, respectively. Further excluding the support for risk assets from the AI industrial trend since 2023, and focusing solely on the period of most concentrated tightening shock from March to December 2022, it can be observed that, except for the U.S. Dollar Index (representing cash, +4.5%) and short-end U.S. Treasuries (+1.4%), major assets such as equities, long-term bonds, and gold all declined.
Chart 7: The 10-year U.S. Treasury yield peaked in October 2023, while interest rate expectations peaked in March 2023.
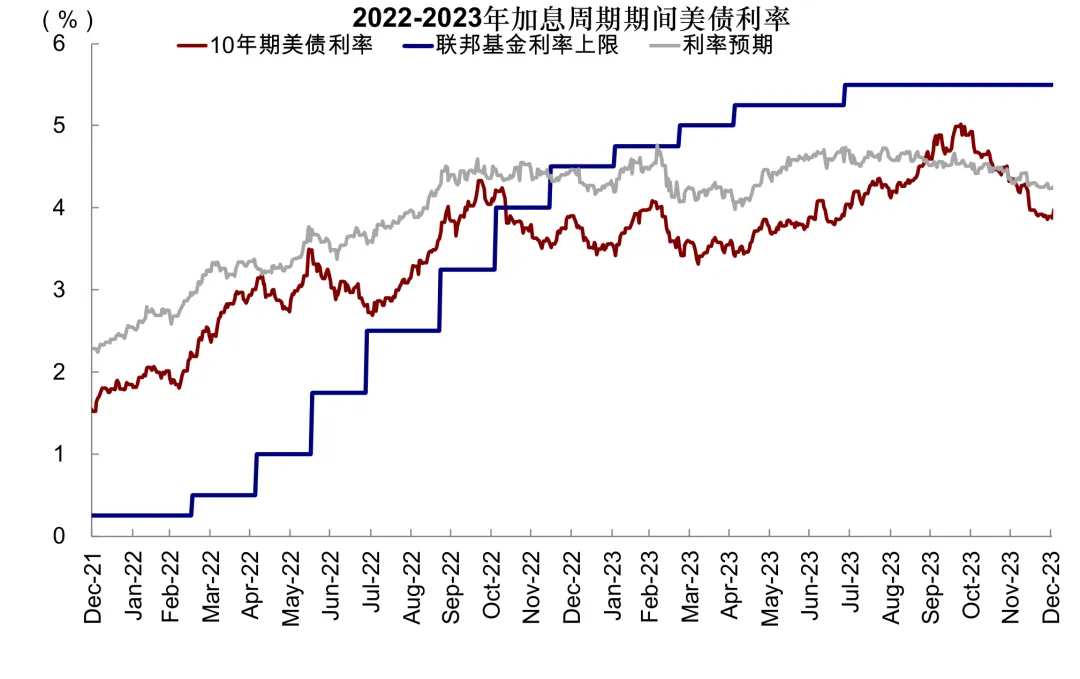
Chart 8: The S&P 500 bottomed out in October 2022, with a decline of 18%.
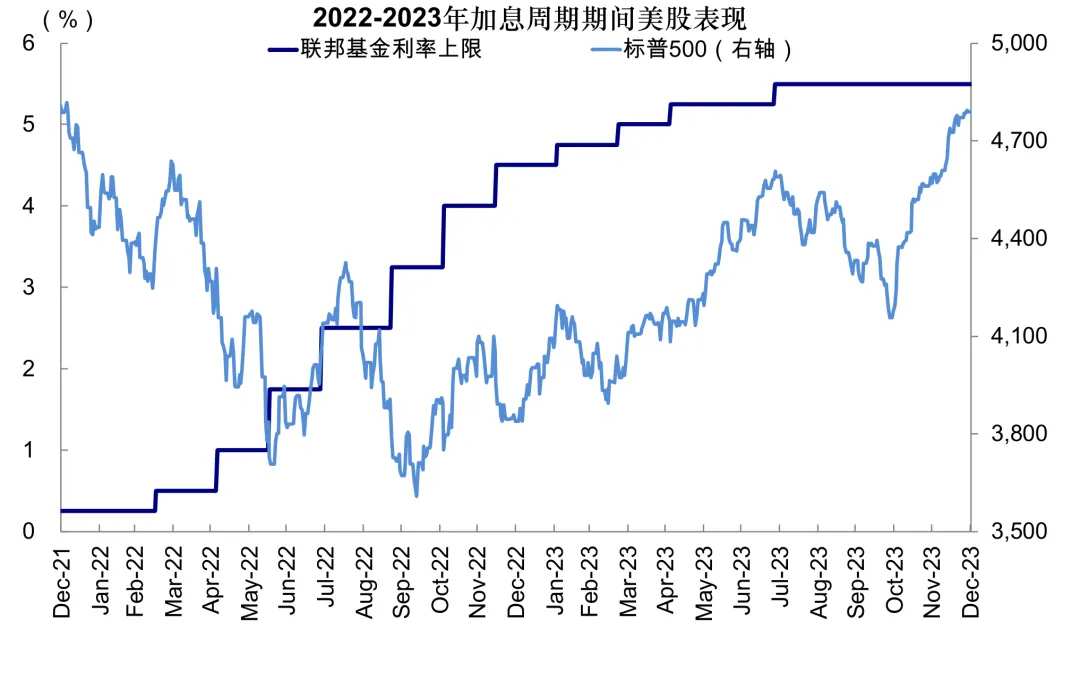
Chart 9: Gold bottomed out in November 2022, with a decline of 16%.
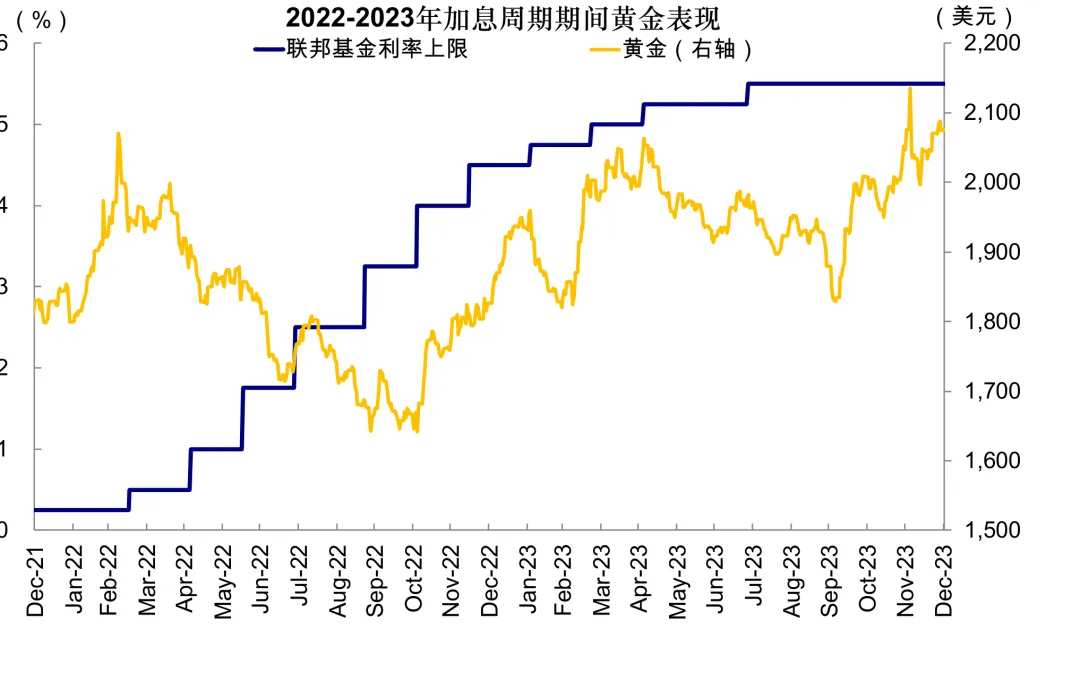
Chart 10: From March to December 2022, all major assets declined except for the U.S. Dollar Index (representing cash) and short-term U.S. Treasuries.
Can sustained and substantial rate hikes occur? Currently, the foundation for this does not exist, unless oil prices spiral out of control.
At present, the basis for consecutive and aggressive rate hikes does not exist, unless the central tendency of oil prices remains sustained above $95 or even higher, making it difficult for year-on-year CPI to decline or even causing it to rise. Conversely, the U.S. economy is currently experiencing K-shaped divergence, with high interest rates suppressing traditional demand. The fundamentals of the U.S. economy may not be able to "withstand" continuous rate hikes, which in turn creates a "reflexivity" that inhibits multiple rate increases.
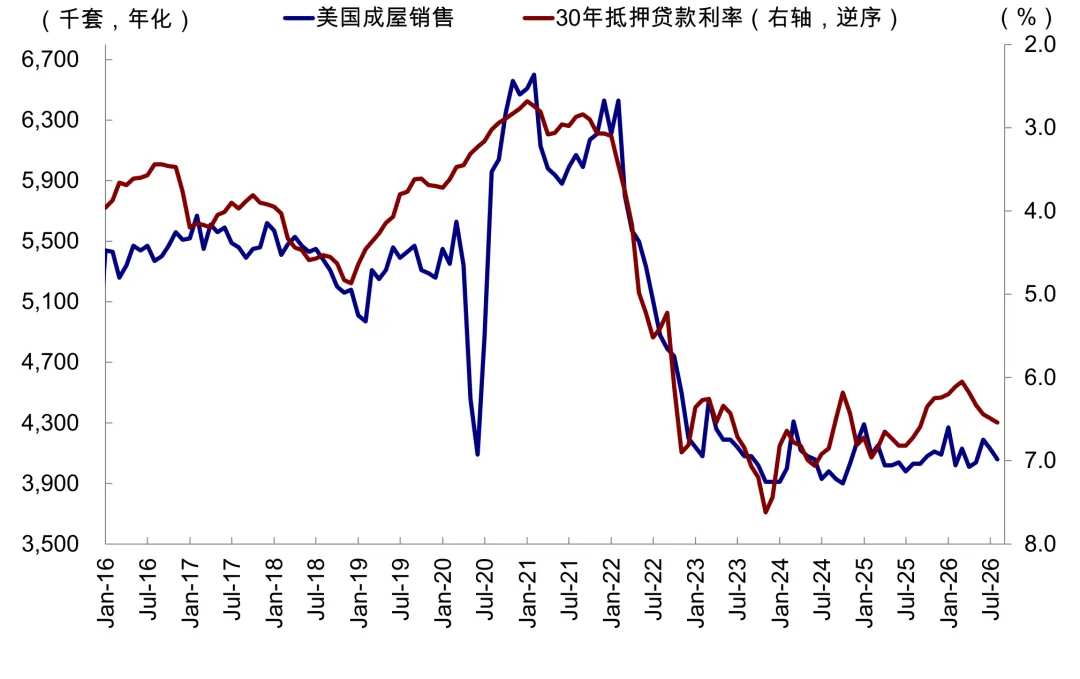
► Traditional demand has already been constrained by high interest rates. The ISM Manufacturing PMI declined in August under the suppression of high rates, with the forward-looking new orders sub-index slipping from 56.7 to 53.7. Interest-rate-sensitive real estate data were also affected, with existing home sales declining again. Furthermore, continued layoffs in the IT and financial sectors in recent years may also disrupt consumption.
Chart 11: Recent rises in interest rates have pushed previously recovering housing data back into decline
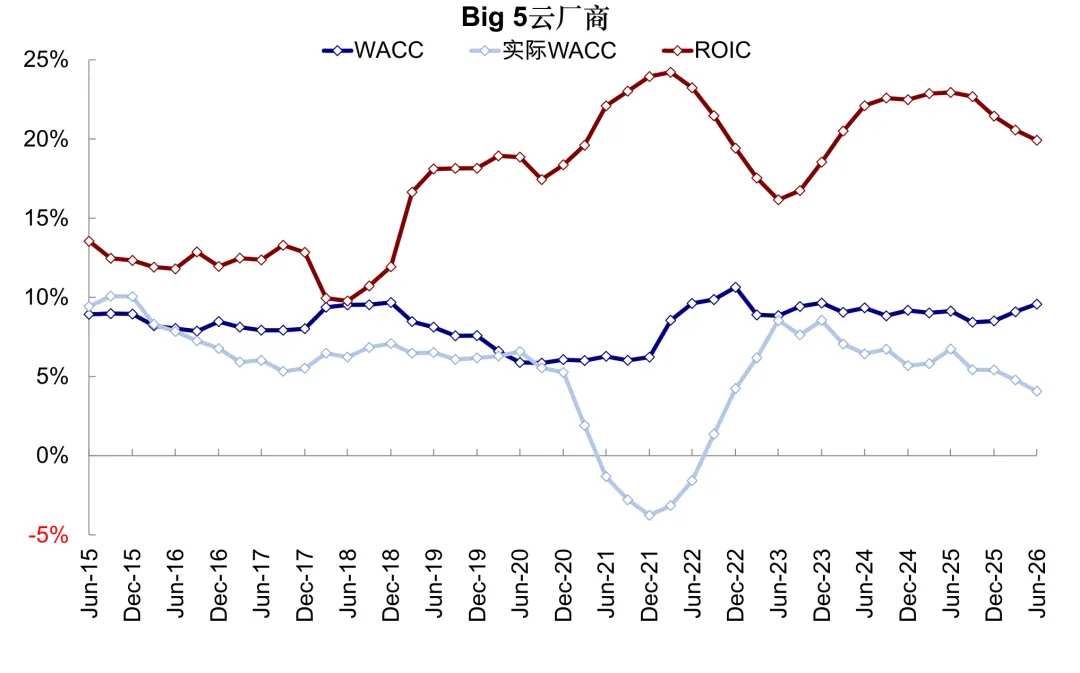
►As AI serves as a key growth engine, its sensitivity to financing conditions is also rising. With cloud providers’ free cash flow turning negative, U.S. AI investment is becoming increasingly reliant on external financing. Although cloud providers’ return on invested capital (ROIC) of 20% still significantly exceeds their weighted average cost of capital (WACC) of 9%, the presence of阶段性 bottlenecks on the AI demand side means that a substantial rise in financing costs could dampen their willingness to undertake capital expenditure.
Chart 12: Free cash flow for cloud providers other than Microsoft and Meta turned negative in the second quarter
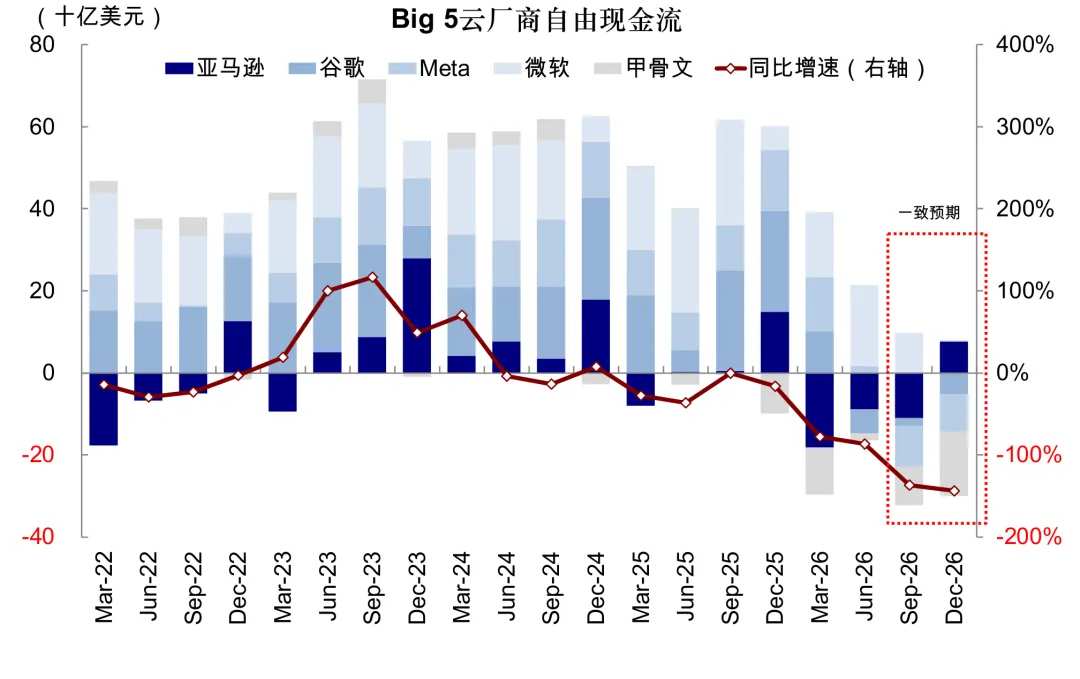
Chart 13: The current weighted ROIC of cloud providers at 19.9% is higher than the WACC of 9%
Under what circumstances would the Federal Reserve shift to multiple consecutive interest rate hikes?
1) Oil prices spiral out of control and remain elevated for an extended period: In the baseline scenario, the central tendency of oil prices in the third and fourth quarters is projected at $80–$90 per barrel, with our estimates indicating that year-on-year CPI will decline to around 3.0% by year-end. However, in an extreme scenario where the central tendency of oil prices remains at $100 per barrel (the average since September) or even higher, year-on-year CPI could exceed 3.6% by year-end, imposing greater pressure on the Federal Reserve.
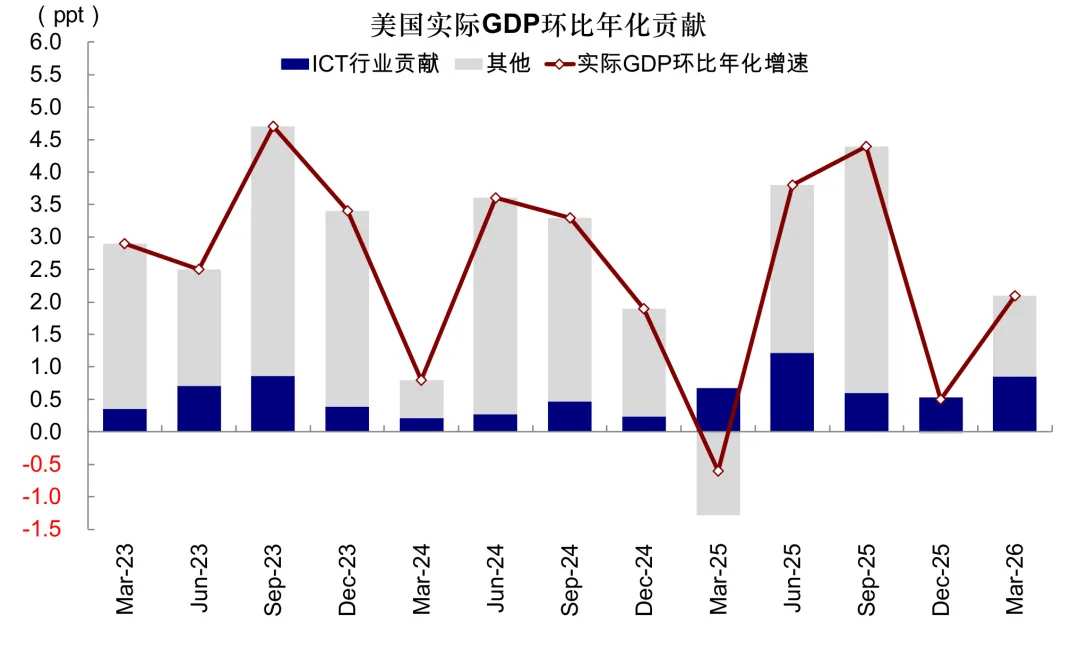
2) AI-related capital expenditure surprises to the upside again: On one hand, this would drive up prices for technology hardware, thereby pushing up core inflation; for instance, electronic components were a significant contributor to the month-on-month increase in the Producer Price Index (PPI) in August. On the other hand, AI has already contributed 40% to the quarter-on-quarter growth of U.S. GDP. If capital expenditure accelerates substantially and even spreads to other sectors, it would be difficult for the Federal Reserve to justify rate cuts by citing weak fundamentals.
Chart 14: Projection of year-on-year CPI trajectory
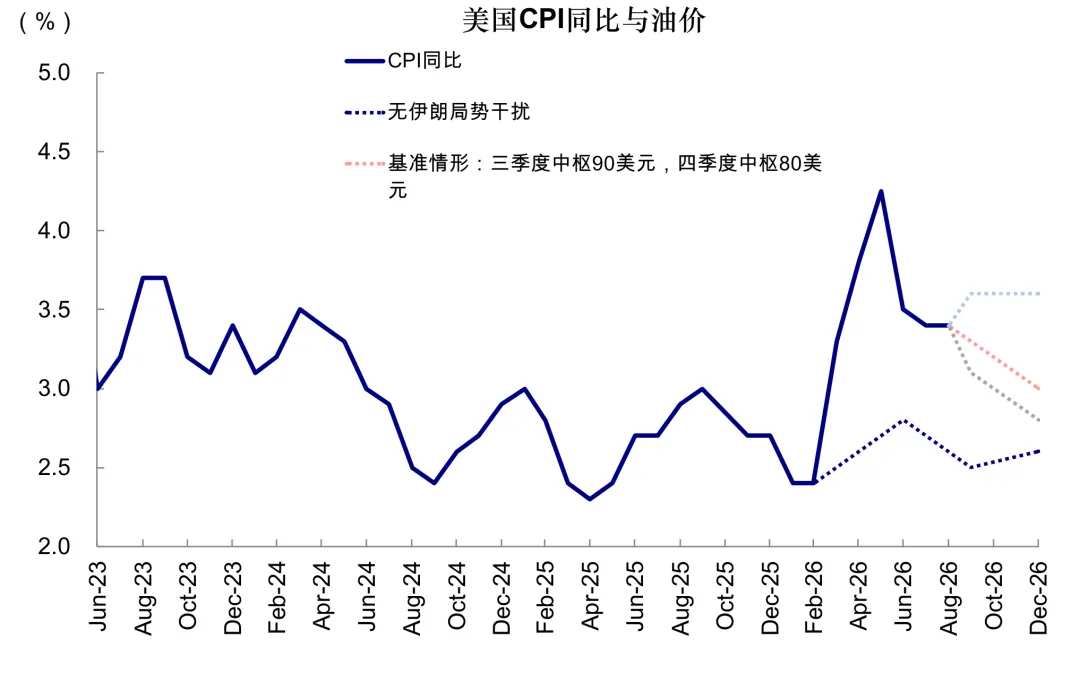
Chart 15: AI contributed 40% to U.S. growth in the first quarter
Implications for assets: Rate hikes are not necessarily bad; they may provide better buying opportunities once market sentiment is fully released; conversely, no rate hikes are not necessarily good.
Based on the above analysis of the reasons for rate hikes and the impact of different hiking patterns, our view diverges from market consensus: We do not regard rate hikes as a catastrophic threat; a rate hike is not necessarily detrimental unless it involves consecutive increases. Conversely, holding rates steady is not necessarily beneficial. While rate hikes do cause disruption, brief hikes are often priced in advance, frequently triggering contrarian market reactions ('buying the dip'). This was observed during the rate cuts in 2024 and 2025, as well as during the rate hikes in 1997. Therefore, any resulting disruption may actually present better buying opportunities. In contrast, forcing a pause in rate hikes to provide short-term stimulus could create greater troubles in the future.
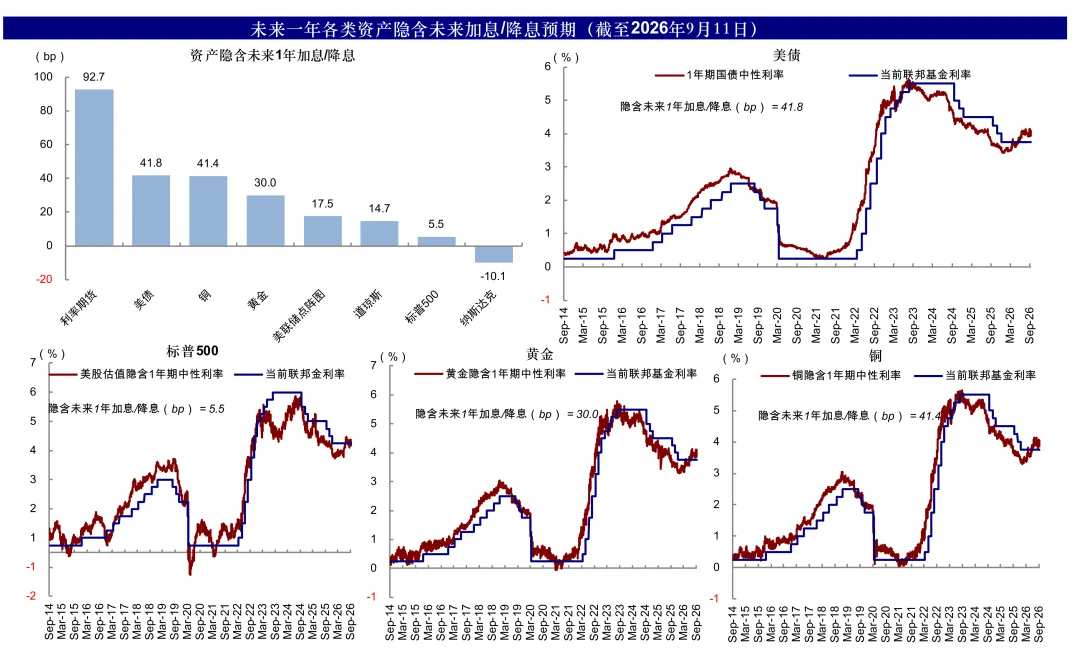
Looking at the expected number of rate hikes over the next year priced in by various assets: interest rate futures (3.7 times) > U.S. Treasuries and copper (1.7 times) > gold (1.2 times) > the Fed's dot plot (0.7 times) > the Dow Jones Industrial Average (0.6 times) > the S&P 500 (0.2 times) and Nasdaq (-0.4 times). Compared to the end of the July FOMC meeting, the expected yield on the 10-year U.S. Treasury rose by 15 basis points, while the 2-year U.S. Treasury yield rose by 30 basis points. This implies that, apart from U.S. equities (particularly tech stocks), which remain relatively optimistic, other assets have fully priced in the expectation of a September rate hike, similar to the situation before the March 1997 rate hike. Specifically:
Chart 16: Expected number of rate hikes over the next year priced in by various assets: interest rate futures (3.7 times) > U.S. Treasuries and copper (1.7 times) > gold (1.2 times) > the Fed's dot plot (0.7 times) > the Dow Jones Industrial Average (0.6 times) > the S&P 500 (0.2 times) and Nasdaq (-0.4 times)
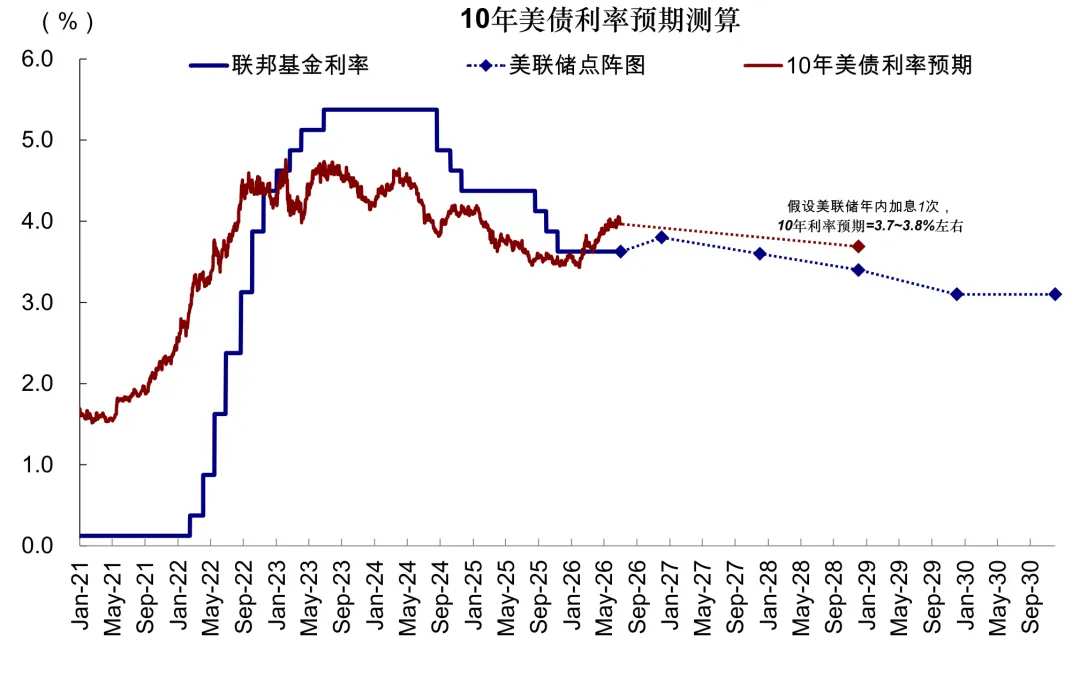
1) US Treasuries: Short-term yields are rising, while the term premium on long-term bonds has initially declined, with overall long-term yields potentially peaking and falling gradually. On one hand, a single rate hike corresponds to a central range of 4.5–4.7%; current long-term yields already price in 1.7 rate hikes for the year, fully reflecting expectations of "preventive rate hikes." On the other hand, once confidence is restored following a rate hike, the term premium pushing up long-term yields will narrow. Therefore, US Treasuries now exhibit characteristics of favorable risk-reward ratios.
Chart 17: If the Federal Reserve raises rates once, corresponding to a US Treasury central range of 4.5–4.7%, trading opportunities exist
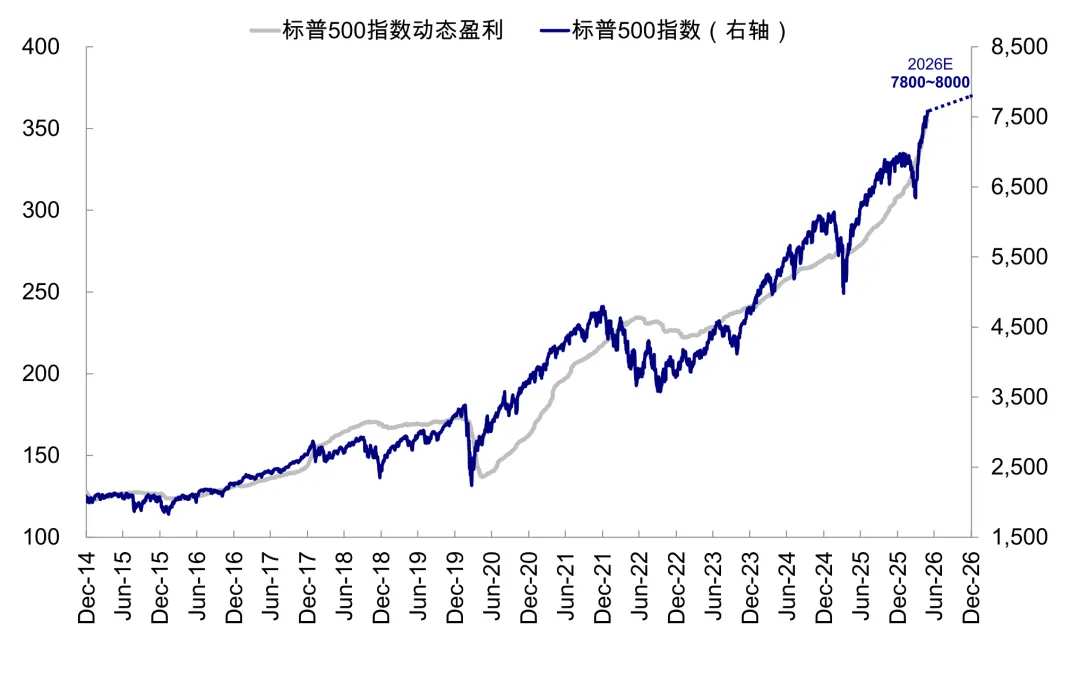
2) U.S. Equities: We are not pessimistic; short-term volatility may even present better buying opportunities. In early June, we further raised our target range for the S&P 500 to 7,800–8,000. After the market reached this level, it began to consolidate amid uncertainty, driven by two factors: first, the need for further catalysts to unlock earnings potential under AI-driven growth, and second, disruptions from macroeconomic factors such as interest rate hikes. With rate hikes now implemented, if new catalysts emerge in the AI industry, U.S. equities still have room to rise. Significant short-term volatility could also provide better entry points.
Chart 18: Under the baseline scenario, we have raised our mid-year target for the S&P 500 index in 2026 to the range of 7,800–8,000.
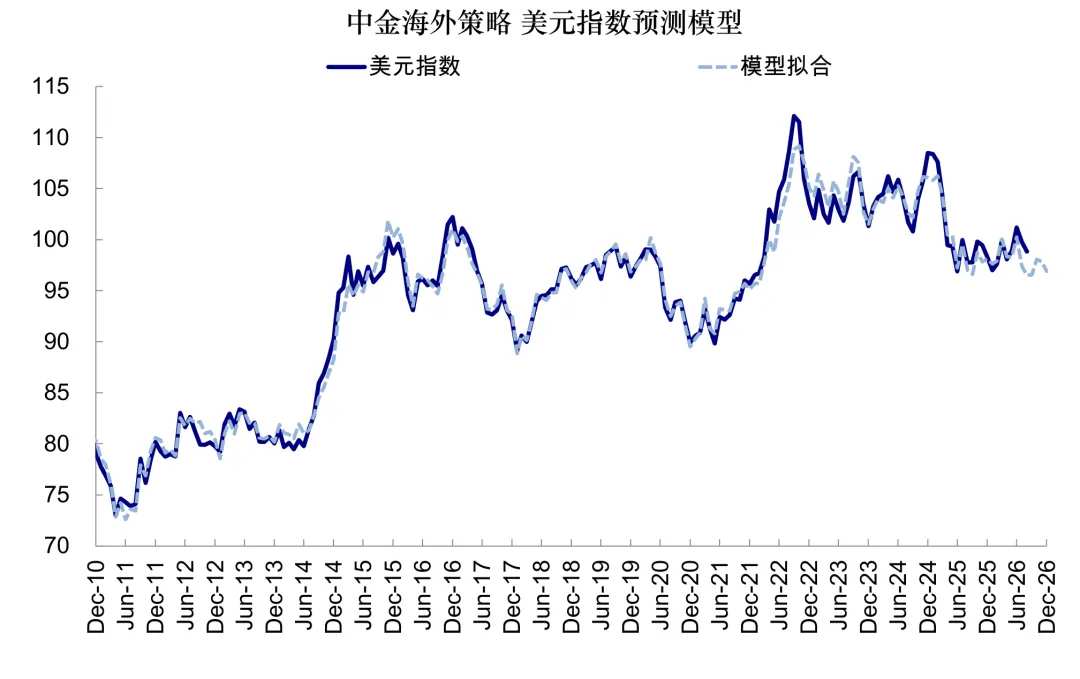
3) U.S. Dollar: If the Federal Reserve’s rate hikes restore market confidence, this will support the U.S. dollar; conversely, a lack of confidence would weigh on it. Our U.S. dollar model projects that the U.S. Dollar Index will fluctuate within the 96–98 range in the second half of the year.
Chart 19: We forecast that the U.S. Dollar Index will oscillate within the range of 96–98 in the second half of 2026, without experiencing a significant decline.
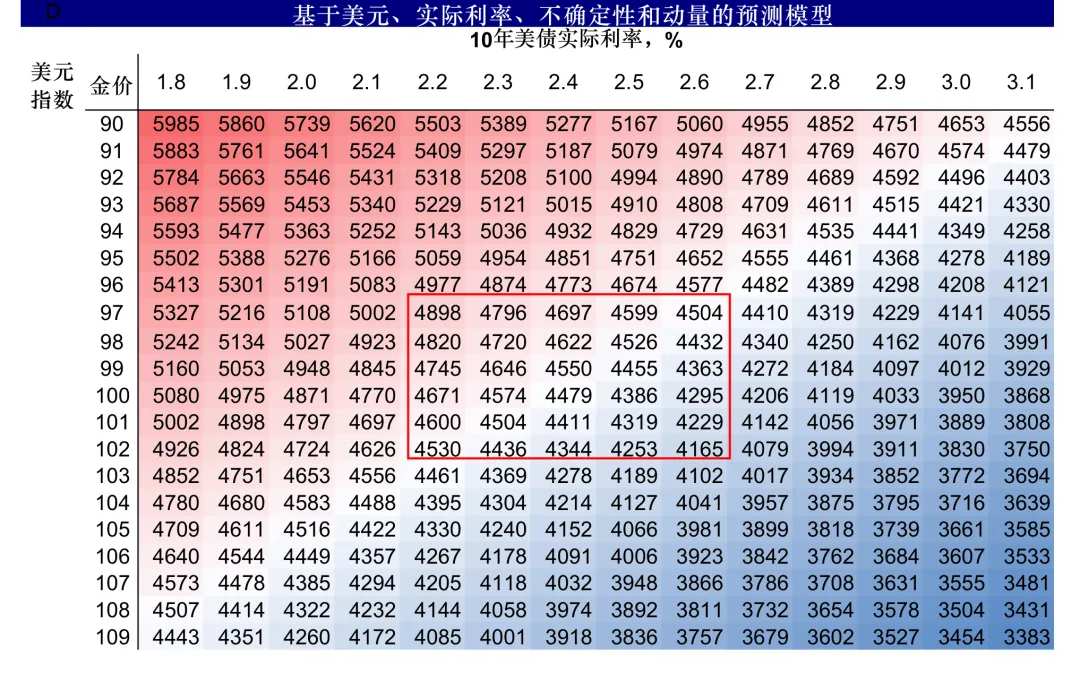
4) Gold: The room for no rate hike is greater than for a rate hike; currently, it resembles a call option with uncertain upside. Based solely on static calculations involving US Treasury yields and the US dollar, gold's support level is around 4,400–4,600. Unless there are consecutive rate hikes, downward pressure on gold is relatively controllable, but upside potential requires more grand narratives. A pause in rate hikes by the Federal Reserve can foster grand narratives of lost confidence and de-dollarization for gold, whereas a rate hike weakens this narrative. Thus, the upside potential is less than in a no-hike scenario, pending further narrative catalysts.
Chart 20: Our static calculation based on U.S. Treasury yields and the U.S. dollar indicates a support level around 4,400–4,600.
Editor/lambor