
Federal Reserve Chair Jerome Powell has twice declined to include interest-rate projections in the Fed's "dot plot," stating outright that the tool is "not helpful for policy implementation." The dot plot, which has been in use since 2011 and releases officials' rate expectations four times a year, serves as an important reference for market participants seeking to gauge the direction of monetary policy. However, it has long faced criticism over issues such as its lack of consensus, anonymity, and the participation of non‑voting governors. Past chairs have adopted varying stances, with Powell taking the most hawkish position.
Federal Reserve Chair Jerome Powell has twice declined to include his own interest-rate projections in the Fed's dot plot, further shrouding in uncertainty the fate of this policy‑communication tool that has been in use for more than a decade.
According to Wall Street Insight, on September 16, the latest dot plot once again showed only 18 dots out of 19, leading most observers to conclude that Richard Fisher's projection was absent once more. This mirrors his approach when he first chaired a monetary policy meeting in June.
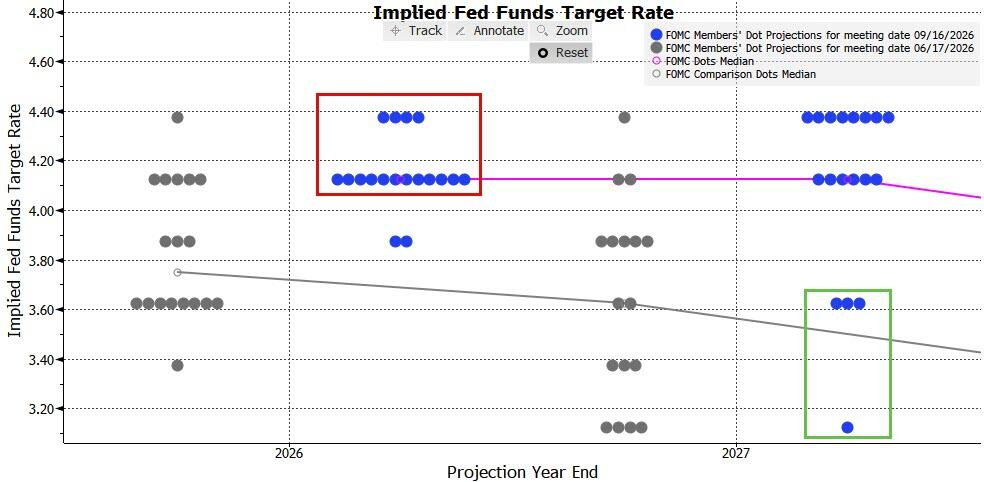
 Previously, Wash had explicitly stated that the dot plot "provides no guidance for policy implementation," and revealed that the Federal Reserve is establishing a new committee dedicated to communications. The future of the dot plot will be subject to a comprehensive review by this committee, with the assessment also encompassing press conferences, meeting minutes, and public statements.
This statement came just as the Federal Reserve announced a 25-basis-point interest-rate hike. Following the meeting, Wash described the decision as "a sober, serious, and responsible one." As a result, the debate over whether to retain or scrap the Fed's dot plot has become the market's new focal point for assessing the trajectory of the Fed's policy transparency.
What is a bitmap?
The dot plot is a scatter chart released quarterly by the Federal Reserve, illustrating Fed officials' projections for the future path of the federal funds rate—the short-term benchmark interest rate under the Fed's control.
Up to 19 rate-setting policymakers may participate in the survey, including the seven members of the Federal Reserve Board and the presidents of the 12 regional Federal Reserve Banks.
Each participant is required to mark a point for the end of the next three years and for the "longer term," representing the midpoint of the interest-rate range they deem appropriate. The market typically pays closest attention to the median trajectory of the dot plot.
The dot plot was introduced in late 2011, at a time when the Federal Reserve was deliberating how to guide markets through the gradual unwinding of its post‑financial‑crisis, highly accommodative monetary policy. Then‑Chairman Ben Bernanke and Vice Chair Janet Yellen hoped that this tool would allow markets to gain insight into the Fed's policy outlook beyond the scope of any given meeting's decisions.
Once a clear shift emerges in the dot plot, it often sends a powerful signal to investors—whether signaling a continuation of the rate-hike trajectory or a growing expectation of rate cuts. At the same time, it serves as a gauge, helping the market discern internal divisions among Federal Reserve officials and the divergence between official policy stances and market pricing.
History is replete with instances where the Fed's dot plot has played a pivotal role. In June 2023, the Federal Reserve held rates steady and refrained from raising them; however, the dot plot signaled that further rate hikes remained possible within the year, effectively tempering overly optimistic market expectations that the tightening cycle had come to an end.
Critics' doubts have been met with varying attitudes from successive chairpersons.
The controversy surrounding dot-matrix displays has been ongoing for a long time, with criticisms primarily focusing on the following points:
First, the dot plot does not represent an official consensus forecast; each official's projections may be based on markedly different economic models and assumptions, lacking methodological consistency.
Second, the dot plot is presented anonymously, leaving the public unable to determine which projection corresponds to which official, thereby limiting transparency.
Third, among the 12 regional Federal Reserve Bank presidents, only five have voting rights on the Federal Open Market Committee each year, raising doubts as to whether the non‑voting members' projections accurately reflect the Committee's policy intentions.
According to reports, Federal Reserve staff had considered consolidating the dot plot into a single official consensus forecast, but the effort ultimately stalled due to significant differences in officials' views.
On the issue of bitmap graphics, successive chairpersons have not maintained a consistent stance.
At her first press conference as chair in 2014, Janet Yellen cautioned the markets:
Dot matrices should not be regarded as the "primary means by which the committee conveys policy signals to the public."
However, after the Federal Reserve lowered its projected number of rate hikes for 2016 from four to two, she again cited the shift in the Fed's dot plot to explain how slower global growth and tighter credit conditions were affecting market expectations.
During Powell's tenure at the Federal Reserve, he generally downplayed the role of the dot plot, but in certain circumstances he also used it to manage market expectations.
Wash's stance, by contrast, was even more pronounced. At the press conference following the June monetary policy meeting, he stated plainly:
I did not submit the forecast point. To me, this is of no help to policy implementation.
He also stated that a comprehensive review of the Federal Reserve's communication strategy is expected by year-end, with the dot plot set to be an integral part of it. This debate over policy transparency is likely to keep markets on edge in the months ahead.
Editor/lambor