
From the Federal Reserve, the U.S. dollar, and the Nasdaq to stablecoins: BTC is becoming an increasingly complex asset.
Stare at a single switch long enough, and you'll start to believe it's connected to every light. We've been watching the Federal Reserve for nine years—so long that we almost forgot: Bitcoin's thread has long since branched off from its original line. It wasn't until I rerun the data from those nine years—2,438 trading days and 62 FOMC meetings—that I realized: it hasn't decoupled from the Fed; it's just been re‑wired.
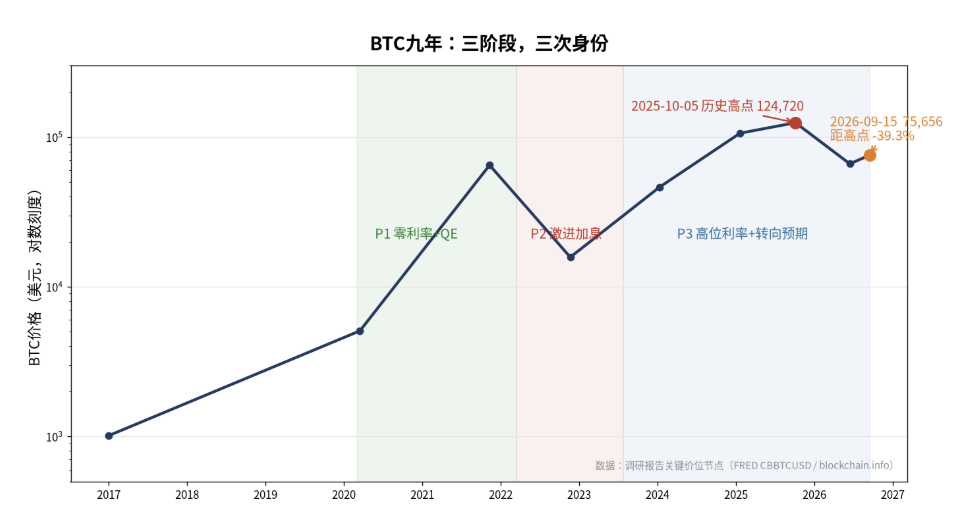
Interest rates were raised, yet BTC didn't plunge; after a year of monetary easing, BTC has instead fallen by 38%.
On September 16, 2026, the Federal Reserve held a meeting that left many on edge. The federal funds rate was raised by 25 basis points, bringing it to a range of 3.75% to 4.00%. This marked the first rate hike in three years, since July 2023. The decision was unanimous, with all 12 members voting in favor. At his first post‑appointment press conference, new Chair Powell signaled that most officials expect another rate increase before year's end, as reflected in the Fed's dot plot.
 On Crypto Twitter, the familiar refrain immediately echoed: rate hikes, tighter liquidity, risk assets are headed lower—BTC is finished.
After the announcement, a quick look at the charts revealed that BTC did not experience the typical "policy‑shock‑driven plunge" immediately following the statement. But that's precisely not the most intriguing aspect of this article. What truly warrants investigation is this: if we extend the time frame to days, weeks, or even years, how exactly does Fed policy translate into movements in the price of BTC?
If a formula has worked fine for nine years, but now pressing the button seems to have no effect, it's either the button that's broken or the wiring that was tampered with long ago.
To clarify this issue, I reran the analysis using data from January 2017 to September 15, 2026. Over 2,438 trading days and 62 FOMC meetings, I used Coinbase's BTC/USD daily closing prices from FRED, with all macroeconomic variables sourced directly from FRED's official series, and stablecoin data drawn from DefiLlama. It should be noted upfront: the data ends on September 15, 2026; the intraday price details for September 16 are not part of this sample and fall outside the scope of this study. The results do not show that "BTC is unaffected by the Federal Reserve" or that "BTC has completely decoupled"; rather, they reveal a set of findings that are even more complicated than either of those conclusions.
Before delving into these facts, let us first set forth a larger paradox.
Prior to the rate hike on September 16, for an entire year—from October 2025 to September 2026—the Federal Reserve's actions were in no way consistent with the term "tightening."
"The formula 'rate cuts and liquidity injection = BTC rally' no longer holds."
Take a look at a set of numbers.
Over the 237 trading days from October 6, 2025, to September 15, 2026, the effective federal funds rate fell from 4.09% to 3.63%, a reduction of 46 basis points. Meanwhile, the Federal Reserve's balance sheet expanded from $6.59 trillion to $6.74 trillion, an increase of $150 billion. M2 growth accelerated from 4.19% year over year to 4.59%, and net liquidity turned positive, moving from –6.74% to +2.02%. During the same period, the Nasdaq 100 rose by 16.8%, while the S&P 500 gained 13.0%.
According to the old script, this is called "total flooding." When you flood the market, prices are bound to rise—and the bigger the flood, the more violently they surge.
During this period, BTC fell from $124,000 to $75,000, a decline of 38.2%.
Water was poured, and the stock market rose—but in the end, the asset that had been drinking the most water over the past decade ended up falling by nearly 40 percent.
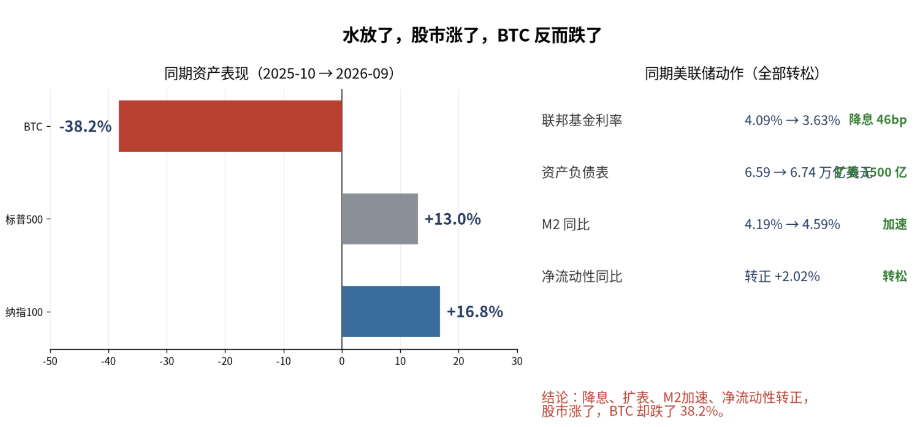
This cannot be explained away as a "short-term fluctuation." In the fourth quarter of 2025, Bitcoin fell 26.09% in a single quarter, while the S&P 500 rose 2.35% and the Nasdaq gained 2.31%. Meanwhile, the M2 money supply declined from 4.48% to 3.96%, the Federal Reserve's balance sheet expanded from $6.59 trillion to $6.64 trillion, and the federal funds rate was cut by 45 basis points, dropping from 4.09% to 3.64%. With both rate cuts and balance-sheet expansion in place, Bitcoin simply refused to rally.
More crucial is the reversal in the relationship. When we align Bitcoin's year-over-year returns with M2's year-over-year growth rate, we find that during Phase P1—March 2020 to March 2022, a period of zero interest rates and quantitative easing—the correlation coefficient stands at 0.716, indicating a strong positive relationship. In Phase P2, the era of aggressive rate hikes, the correlation remains positive at 0.520. But by Phase P3, the period of elevated interest rates—from July 2023 to the present—the correlation has turned negative, at −0.766. Even as M2 expands at an accelerated pace, Bitcoin has been trending downward.
I must first apply some caution. This is not to say that liquidity is unimportant. At the level‑of‑series scale, M2 and BTC appear highly correlated, but the Engle–Granger cointegration test reveals that ln(BTC) and ln(M2) are not cointegrated across all three periods, with a p‑value of 0.729—suggesting that the two trend‑adjusted series happen to move together by chance, with no long‑run equilibrium relationship. Consequently, the high R² obtained from a regression on level variables reflects a spurious regression. On the year‑over‑year basis, which aligns frequencies more appropriately, the notion that "monetary easing inevitably leads to price increases" no longer holds as a cross‑cycle pattern in Period 3.
So does that mean the Federal Reserve can no longer regulate Bitcoin?
It's not that we can't manage it; it's that we've chosen the wrong vantage point.
Looking at daily returns, the relationship between interest-rate changes and Bitcoin is strikingly weak. In a full-sample daily-frequency regression, the correlation coefficient between M2 month-over-month growth and Bitcoin's daily return is –0.036 across the entire sample, with a peak of only +0.031 in any of the three sub‑periods. Similarly, the correlation between the Federal Reserve's balance sheet year-over-year growth and Bitcoin's daily return is –0.029 across the full sample, and it remains statistically insignificant in every phase. The daily change in the federal funds rate exhibits a correlation of –0.001 with Bitcoin's daily return, also across the full sample. The evidence strongly suggests that the two are decoupling.
But there's a problem with the frequency of observations here. Looking solely at daily returns amounts to mashing together signals from all directions—expected rate hikes, unexpected hawkish moves, unexpected dovish ones, and ordinary days with no news—then computing a single correlation coefficient. Positive and negative signals cancel each other out, so in the end it naturally appears as if there's no relationship at all.
I isolate FOMC meeting days for event‑study analysis. On FOMC days, the average daily change in the 2‑year U.S. Treasury yield is 6.34 basis points, compared with 3.89 basis points on non‑FOMC days, a difference that is statistically significant (p = 0.0015). Rather than directly employing high‑frequency target/path surprises, I use the day‑to‑day change in the 2‑year Treasury yield on FOMC days as a daily proxy for monetary‑policy‑related shocks. It should be noted that, beyond expectations about monetary policy, the 2‑year yield also incorporates inflation expectations, growth expectations, the term premium, information from press conferences, and other macroeconomic news released that day; thus, it serves as an imperfect proxy rather than a clean measure of policy surprises. In what follows, "shock" refers to the tight‑leaning monetary‑policy shock captured by this proxy variable. I then apply Jordà's (2005) local projection method to estimate, for each horizon h—defined as the hth trading day after the FOMC—regressions that link cumulative returns from the close of the day before the FOMC to h days later to the monetary‑policy shock embodied in the 2‑year yield.
In other words, I no longer ask, "How much did BTC fall today after the rate hike?" Instead, I ask, "Following a moderately tight monetary policy shock today, what happened to BTC over the next 1 day, 3 days, 10 days, 20 days, and 30 days?"
The result is completely different.
According to the daily-frequency definition used in this paper, BTC's cumulative response on the trading day of the FOMC meeting is close to zero. At h = 0, the estimated coefficient β is −0.11%, with a t‑statistic of −0.29, which is statistically indistinguishable from zero. It is important to explicitly acknowledge a methodological limitation: FOMC announcements are released at 2:00 p.m. Eastern Time, while BTC trades 24/7; this study relies on FRED's daily closing prices, making it impossible to precisely capture the high‑frequency, immediate reaction following the announcement. In other words, the observation that "h = 0 yields virtually no response" refers to the absence of a discernible effect within the daily event window, not to the claim that the market shows no reaction at all in the high‑frequency sense. In their staff report SR1052, Benigno and Rosa of the New York Fed describe the "Bitcoin–Macro Disconnect," which is itself based on an intraday event study; they conclude that BTC exhibits no significant response to macroeconomic news over the sample period. The daily‑frequency results presented here for h = 0 are consistent in direction with their findings, but they should not be equated directly.
However, as h is pulled further back, the results diverge: at h = 1, BTC remains virtually unchanged, down 0.03%; at h = 5, it falls by 1.43%; and by h = 10, the cumulative negative response reaches 2.60%, with a t‑value of −1.88, indicating marginal significance. This magnitude is 3.7 times that of the Nasdaq's −0.70% over the same period and 5.8 times that of the S&P 500's −0.45%. Subsequently, at h = 20, the decline narrows to −1.22%, and by h = 30, it further recedes to −0.54%.
It's not that there's no response—it's just that the response is slow, and it's quite strong.
Now consider the subsample following the ETF's listing. After the spot ETF was approved on January 11, 2024, there were only 21 FOMC meetings, resulting in a small sample size. I must emphasize upfront that these coefficients provide directional evidence rather than precise estimates, and the subsequent exact figures should not be overstated. Nevertheless, the direction is quite clear: prior to the ETF launch, BTC exhibited positive but statistically insignificant coefficients across all horizons in response to tighter policy; at horizon h=30, the coefficient even reached +0.683, suggesting near‑complete immunity. Following the ETF's launch, the negative impact grows monotonically with longer horizons: at h=1, the coefficient is −0.182; at h=3, −0.403; at h=7, −0.687; at h=14, −0.857 (t = −2.53); and at h=30, −1.063 (t = −2.07). The 30‑day effect is 5.8 times as large as the one‑day effect.
This is not a liquidity‑driven flash crash that was quickly reversed on the day of the announcement; rather, it resembles a re‑pricing of valuations—market participants will need several weeks to gradually absorb a relatively tight policy signal.
The Federal Reserve isn't issuing a "buy‑or‑sell order" for Bitcoin. Rather, it's like dropping a stone into the financial system—its ripples spread outward, one wave after another.
Bonds took the hit first, stocks followed, and BTC came last—yet it plunged the hardest.
Rank the response times of each asset to the same tight monetary policy shock.
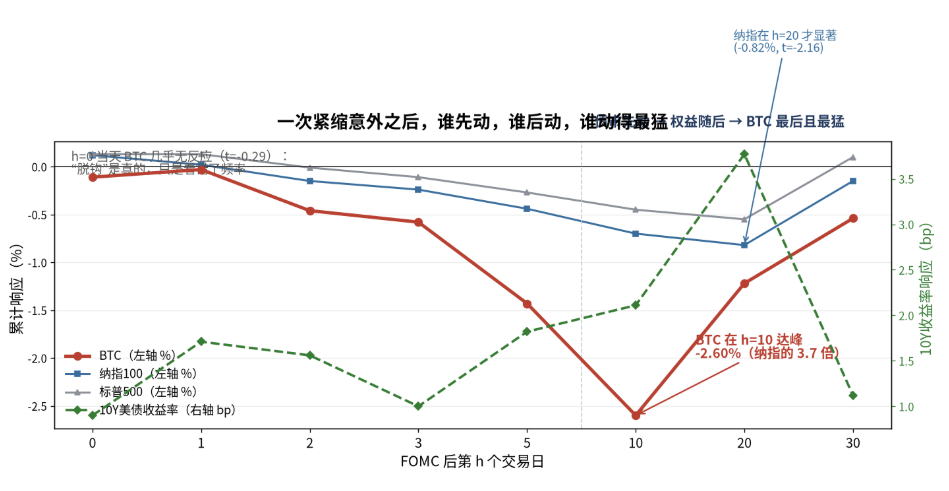
On the first trading day, the yield on the 10-year U.S. Treasury note rose significantly by 1.71 basis points, with a t‑value of 2.46—making it the only asset in the entire sample that achieved statistical significance at h=1. The bond market is the first to price this; this is the textbook's first layer of analysis.
Around the 20th trading day—roughly one month later—the Nasdaq-100 and the S&P 500 only reached statistical significance: the Nasdaq had cumulatively declined by 0.82% (t = −2.16), while the S&P 500 fell by 0.55% (t = −2.26). The second tier of the stock market.
BTC reaches its peak response at h=10, with an amplitude of –2.60%. Its timing of response falls between that of the bond market and the stock market, yet its magnitude is several times greater.
What about the U.S. dollar index? Across all eight horizons, from h=0 to h=30, the absolute values of the t-statistics are all below 1, with the highest reaching only 0.97, and none are ever statistically significant.
To illustrate: Imagine a shopping mall suddenly loses power. The first to know is the electrical distribution room—when the current cuts out, the surveillance system immediately triggers an alarm. Next come the tenants on each floor; as soon as the lights go out, people start panicking. Only at the very end do those in the parking lot who are about to leave become aware—the news spreads slowly, but the crush at the exits is often the most severe.
BTC is a bit like that parking lot: it wasn't the first to get the word, but in the end, the stampede was the worst.
An exploratory Baron–Kenny mediation analysis also points in the same direction. At the contemporaneous horizon (h = 0), the Nasdaq index emerges as the only significant candidate mediator, with a t‑statistic of 2.35 and a p‑value of 0.022. After controlling for the Nasdaq, the direct effect of policy shocks captured by the two-year Treasury yield on BTC diminishes from −0.107 to −0.071, representing a 34% reduction. By contrast, the U.S. dollar does not emerge as a significant mediator, with a t‑statistic of −1.63 and a p‑value of 0.109; moreover, its estimated coefficient even reverses the expected sign. These findings suggest that the contemporaneous statistical relationship is consistent with an "equity market channel," but they do not independently establish a causal transmission mechanism. Given that mediation analyses are susceptible to issues such as contemporaneous correlation, omitted variable bias, and measurement error, the results should be interpreted only as indicative of directionality.
The U.S. dollar and Bitcoin often move in opposite directions, but the Federal Reserve does not rely on the dollar to send signals.
The most widely circulated chart in the crypto world goes like this: when the Fed raises interest rates, the U.S. Dollar Index (DXY) rises, and BTC falls. The causal chain is straightforward—and it makes sense at first glance.
However, it is important to distinguish between two distinct issues here.
The first question is whether the U.S. dollar and Bitcoin tend to move in opposite directions. The answer is yes, and this represents one of the most stable, simple macroeconomic relationships across market cycles. The daily correlation coefficient over the full sample is –0.197, with values of –0.236, –0.281, and –0.097 across three distinct phases—each statistically significant. Whether during periods of quantitative easing, interest-rate hikes, or the current high‑price environment, a strong U.S. dollar has consistently weighed on Bitcoin, with the magnitude of that pressure varying over time.
The second question is whether the Federal Reserve transmits policy shocks to Bitcoin via the U.S. dollar. This hypothesis finds no support within the event‑study framework. As noted earlier, over the 30 days following FOMC meetings, the DXY's response to tightening‑bias monetary policy shocks is statistically insignificant across all horizons—when the Fed throws a stone toward tighter policy, the ripple in the dollar index remains virtually undetectable.
In mediation analysis, there is a more nuanced reversal that warrants separate discussion.
Before ETFs were listed, the Fed's influence on BTC relied primarily on the U.S. dollar. Tighter policy shocks pushed up the DXY (a = +4.29, t = 4.87), while a stronger dollar weighed on BTC (b = −0.035, t = −3.60), yielding an indirect effect of −0.152. Meanwhile, the U.S. equity channel was entirely severed: during the event window, Fed‑induced shocks had no impact on the Nasdaq, and the Nasdaq, in turn, did not predict BTC.
After the ETF's listing, this channel broke. The impact of relatively tight policy continues to push up the DXY (a = +3.73, t = 2.46) and real interest rates (a = +0.296, t = 2.70), with the Fed's influence on traditional macroeconomic variables remaining unchanged. However, the DXY's marginal effect on BTC has declined from −0.035 to −0.002—almost zero—while its indirect effect has shrunk to −0.007. At the same time, a direct transmission channel from the Fed to BTC has opened, yielding a total effect of −0.182 with a p-value of 0.054—indicating the existence of a direct pathway that bypasses the U.S. dollar, the Nasdaq, and real interest rates.
"It's true that the U.S. dollar and Bitcoin often move in opposite directions." "The Fed has been transmitting shocks to Bitcoin via the dollar," but that narrative no longer holds after the ETF approval. These two statements are not contradictory.
What exactly has changed after ETFs?
Everyone assumed that ETFs would bring Bitcoin to Wall Street, turning it into a more conventional tech stock. But the data tells a different story.
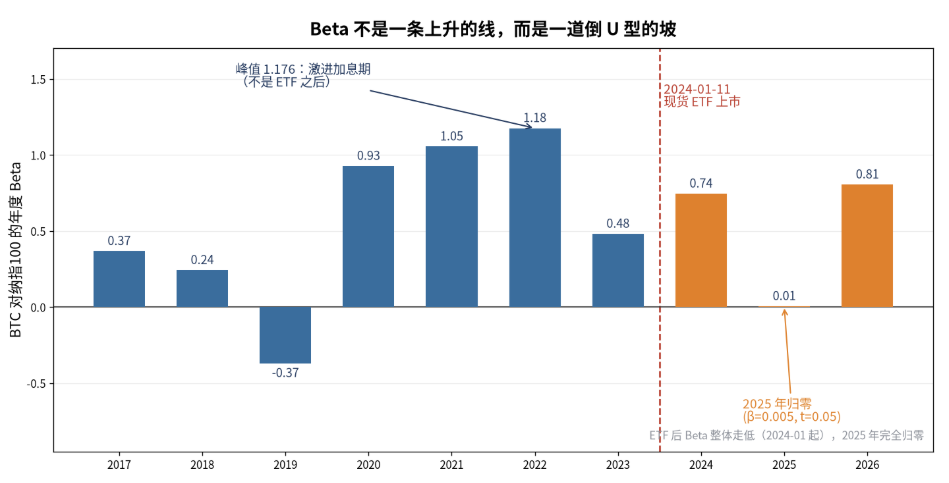
Let me start by making a point that requires full transparency. If we regress Bitcoin's daily returns against the S&P 500's daily returns and conduct a Chow structural break test using the ETF's listing date—January 11, 2024—as the breakpoint—the F-statistic comes out to 1.51, with a p-value of 0.221. Strictly speaking, this does not allow us to reject the null hypothesis of "structural stability." Moreover, the estimated betas for the two periods are both quite noisy: before the ETF, β = −0.130 (t = −1.41), and after the ETF, β = +0.178 (t = 1.45), neither of which is statistically significant. Therefore, we cannot simply apply the claim that "β fell from 0.789 to 0.417—a 47% decline that is statistically significant" to the S&P 500.
We conducted the same test on the Nasdaq 100. The interaction-term regression shows that the coefficient β declines from 0.789 to 0.417, with a t‑statistic of −2.70 and a p‑value of 0.0071; the Chow F‑statistic is 3.944, with a p‑value of 0.0195, which is statistically significant. However, it is important to note that the Nasdaq 100 has a different sample start date, and its β exhibits a highly non‑monotonic pattern over time: in 2019, β was still −0.371; during the aggressive rate‑hike period in 2022, it surged to a peak of 1.176; by 2023, it had fallen back to 0.481; in 2025, it dipped to nearly zero at 0.005; and by 2026, it had rebounded to 0.805. This does not represent a stepwise change where "as soon as an ETF is launched, β immediately plunges."
The structural changes that can truly withstand statistical scrutiny are the following three.
First, volatility has declined systematically. BTC's annualized volatility fell from 75.1% before the ETF launch to 48.5% afterward, a drop of roughly 35%. This is the most compelling metric, with both its direction and magnitude beyond dispute. With less retail‑driven noise, pricing is beginning to normalize.
Second, the one‑day lead of U.S. equities over BTC has strengthened. Cross‑correlation analysis shows that the predictive power of the S&P 500's prior‑day return for BTC's same‑day return increased from 0.255 before ETFs to 0.379 after ETFs, with a stable peak at lag +1. This aligns with Mohamad (2025), who found—at a 5‑minute frequency—that "ETFs drive BTC price discovery roughly 85% of the time," suggesting that U.S. equity markets exhibit higher price‑discovery efficiency: macroeconomic information is first priced into U.S. stocks and then transmitted to BTC via ETF‑related capital flows.
Third, the 90-day rolling average of BTC–S&P 500 correlation rose from 0.002 before the ETF launch to 0.062 afterward, with a Welch t‑statistic of −11.14 and a p‑value below 0.001. While co‑movement has indeed increased in statistical terms, the magnitude of this rise is still far from suggesting that "BTC has become like the Nasdaq."
Taken together, these three developments point in the same direction: with institutional investors entering the market, information flows between BTC and U.S. equities have accelerated, price discovery has become more synchronized, and pure speculative noise has diminished. However, this does not mean that BTC has turned into a high‑beta tech stock, nor does it imply that the Nasdaq can account for most of BTC's volatility—after the ETF launch, the R² of the Nasdaq 100's single‑factor regression was only 0.035, indicating that the Nasdaq explains less than 4% of BTC's price movements.
There is another point that runs counter to the intuition that "BTC is becoming more like a stock." As noted earlier, following the launch of ETFs, BTC's negative response to tight monetary policy began to accumulate over a 2- to 4‑week horizon, with a 30‑day beta of –1.063—indicating that its sensitivity to macroeconomic policy signals has shifted from "virtually immune" to "delayed yet persistent repricing."
These two phenomena can coexist. Bitcoin may be more sensitive to Federal Reserve shocks, yet it does not price in those shocks as swiftly on FOMC days as the Nasdaq does. This is because macroeconomic sensitivity and stock beta are fundamentally different concepts: the former concerns whether policy shocks ultimately get reflected in asset prices, while the latter measures how closely Bitcoin's daily moves track those of the Nasdaq. Following the launch of ETFs, the former has been building up, whereas the latter has been declining.
It's not the Federal Reserve leading Bitcoin; more often than not, Bitcoin is the first to spot the risks.
When conducting the Granger causality test, I encountered the most surprising set of results in the entire study.
A Granger causality test with a five-period lag on daily returns reveals that, during P1—the period from March 2020 to March 2022 characterized by zero interest rates and quantitative easing—the statistically significant direction is BTC leading macroeconomic variables, rather than the reverse. Specifically, BTC leads the S&P 500 (p-value = 0.0015); BTC leads the VIX (p-value = 0.0001); BTC leads the U.S. Dollar Index (p-value = 0.018); and BTC leads the 10-year real yield (p-value < 0.0001). For the Nasdaq, the relationship in P1 is bidirectional: BTC leads the Nasdaq (p-value = 0.012), while the Nasdaq also leads BTC (p-value = 0.042).
P3—from July 2023 to the present—again shows an overwhelming trend in this direction. BTC outperforms the S&P 500, with a p-value below 0.0001; BTC outperforms the Nasdaq 100, also with a p-value below 0.0001; and BTC outperforms the VIX, again with a p-value below 0.0001. In contrast, macroeconomic variables have no statistically significant impact on BTC during this period.
Only during the P2 phase—the aggressive rate-hike cycle from March 2022 to July 2023—did we see a genuine "macro‑variable leading BTC": the 10‑year U.S. Treasury yield led BTC, with a p‑value of 0.0089; and the 10‑year real interest rate led BTC, with a p‑value of 0.049. This was the sole period in the entire sample when BTC was driven by interest rates.
Granger causality is not economic causality; it concerns temporal predictability—whether past values of X can help forecast future values of Y, providing more information than relying solely on Y's own historical data. Moreover, some of this lead may stem from the fact that Bitcoin trades 24 hours a day, seven days a week, whereas U.S. equities and bond markets are open only during weekday business hours. Events in Asia and over the weekend are priced into Bitcoin first, with U.S. markets catching up once they open. This mechanical lead arising from trading‑time differences does exist, and common shocks—where both markets simultaneously respond to an unobserved third factor—cannot be ruled out by Granger causality tests.
Yet even when these caveats are clearly articulated, the findings still upend a widely held narrative. Most analysts predict Bitcoin by fixating on the Federal Reserve and liquidity metrics. The data suggest that, with the exception of the aggressive rate‑hike cycle in 2022, the statistical foundation for such "macro‑driven BTC forecasts" is rather thin. Conversely, Bitcoin's price movements often precede—statistically speaking—the shifts in macro sentiment indicators like the VIX, the S&P 500, and the Nasdaq. It resembles a canary that may chirp well ahead of time: as soon as gas concentrations in a mine begin to rise, it might tilt its head first. However, this "lead" is a statistical one—not evidence that Bitcoin truly "sees" the future—and it does not rule out the possibility of common shocks or the 24/7 trading structure amplifying such lead effects. By the time traditional indicators sound the alarm, it's sometimes already half a beat too late, or the signal may simply be noise emanating from Bitcoin itself.
This does not contradict the earlier claim that "BTC is the final layer in the transmission chain." The two points address different dimensions: during FOMC‑related events, identifying causal shocks, BTC indeed completes repricing only after the bond and equity markets; yet in everyday time series—when there are no clear policy announcements—BTC, owing to its 24/7 trading activity and sensitivity to market sentiment, tends to price in latent risks ahead of traditional markets. One concerns "how policy shocks propagate," while the other focuses on "who detects risk appetite first."
Some of the BTC funds have already stayed within the crypto ecosystem.
Earlier, we found no cointegration between M2 and BTC across all three stages, with a p-value of 0.729. However, applying the same tests to stablecoins yields entirely different statistical results. The Engle–Granger cointegration test for ln(BTC) and ln(stablecoin total market cap) yields a test statistic of −4.160 and a p-value of 0.0042, indicating a statistically significant long-run equilibrium relationship between the two. This suggests that stablecoins and BTC may exhibit a more stable, long-term co-movement than M2 does; nonetheless, this does not yet constitute evidence of causality. Cointegration could stem from shared factors such as overall market‑size growth, the expansion of the crypto ecosystem, or broader adoption trends, and therefore cannot be taken to imply that "stablecoins drive BTC."
The year-over-year dynamics are even steeper. The year-over-year correlation between stablecoins and BTC was −0.007 in 2024—virtually zero—rising to 0.312 in 2025, 0.743 in 2026, and reaching 0.891 over the most recent rolling year. Meanwhile, during the same period, the year-over-year correlation between M2 and BTC in the P3 window stood at −0.766. Thus, two measures of liquidity—one conventional, M2, and the other crypto‑specific, stablecoins—are sending signals in precisely opposite directions. Only the stablecoin series passes the cointegration test.
I must also lay out the other side of the story and avoid cherry-picking only the most favorable figures. At the weekly frequency, the relationship between stablecoins and Bitcoin is weak and unstable. The correlation coefficient between weekly changes in stablecoins and weekly returns on Bitcoin is merely –0.093, and a Granger causality test at the weekly level yields a p-value of 0.0569, which is not statistically significant. Moreover, a lead–lag analysis reveals that when stablecoins lead by five weeks, the correlation rises to 0.201—suggesting, rather, that Bitcoin leads stablecoins. Similarly, the correlation between the 30‑day growth rate of stablecoins and daily Bitcoin returns is only –0.033. Oefele's (2025) research likewise finds that ETF capital flows are a consequence of price movements, not their cause: funds flow in only after prices have risen, pointing to clear reverse causality.
This means that stablecoins are not a short-term trading signal. You can't gauge whether BTC will rise or fall tomorrow simply by looking at how much the supply of stablecoins has expanded today. Rather, stablecoins act more like a slow-moving variable, influencing the valuation anchor rather than intraday price swings.
What truly carries informative value is the state‑dependent regression. I group my sample according to the rate of growth of stablecoins: when stablecoins are in a phase of rapid expansion, the beta for BTC and the S&P 500 is −0.220, with a t‑statistic of −2.10, indicating a statistically significant negative correlation—under these conditions, BTC moves inversely to U.S. equities and exhibits its own independent price dynamics. By contrast, when stablecoin growth stalls, BTC only weakly and positively tracks U.S. equities (β = +0.082, not statistically significant).
This is the most central concept of the entire text. BTC currently faces two distinct liquidity systems simultaneously.
One set comprises traditional financial liquidity—Fed interest rates, M2, the U.S. dollar, and equity market risk appetite. This influences Bitcoin via ETF‑based capital flows and institutional cross‑asset allocation. The other set is crypto‑specific liquidity—stablecoin issuance and redemption, on-chain fund inflows and outflows, and risk appetite within the crypto ecosystem. This second stream circulates independently of the traditional financial system.
From October 2025 to September 2026, that paradox finally found an answer. Water was indeed released—but it was the Federal Reserve's water; meanwhile, when BTC fell, the total market capitalization of stablecoins did not shrink in tandem but continued to expand, climbing from over $300 billion to above $310 billion and hitting a new all-time high. This at least suggests that the decline in BTC prices was not accompanied by a corresponding disappearance of crypto‑dollar liquidity, implying that the rhythms of traditional liquidity and crypto‑internal liquidity may have diverged. However, this should not be simplistically interpreted as "money hasn't left crypto"—stablecoins can remain in on-chain wallets, sit on exchanges, flow into DeFi, be used to purchase government bonds (RWA), lie idle, be held by arbitrageurs, or be transferred within institutions. The expansion of stablecoin market cap merely indicates that stablecoin supply has not contracted in sync; it does not mean that all funds are waiting to buy BTC. A BIS working paper, WP1219, finds that following monetary tightening, stablecoin market caps tend to decline while money‑market fund AUM rises—moving in the opposite direction to traditional liquidity. This suggests that stablecoins' response to monetary policy is inherently slow and cumulative, rather than something that can be observed within the 30‑day window following an FOMC decision.
So what exactly is BTC?
It is not digital gold. During the 5% of trading days when the VIX surged most sharply, Bitcoin posted negative average returns across all three phases, with a greater than two-thirds probability of falling; during periods of aggressive Fed rate hikes, the odds of a decline stood at 88.9%, with an average drop of 5.67%. When panic sets in, it fails to act as a safe haven—it falls along with the broader market—and often does so more sharply.
Nor is it another Nasdaq index. After accounting for ETFs, the Nasdaq 100 single factor explains only 3.5% of BTC's volatility, and in the first quarter of 2025, BTC and the Nasdaq even exhibited a significant negative correlation (β = −0.377, t = −2.47).
More accurately, it has four faces, and which face is revealed depends on its current state.
When confronted with a tightening‑bias policy shock from the FOMC, it functions as a macro‑sensitive risk asset. Following the release of an ETF, the cumulative impact of such tightening signals tends to weigh on its price over the ensuing weeks, with a 30‑day cumulative effect on the order of 1%. However, unlike the Nasdaq, which adjusts its valuation within half an hour, this asset takes several weeks to gradually reprice itself.
When the market is gripped by extreme panic and the VIX surges, it acts as a high‑beta amplifier. During the worst 5% of days for the S&P 500 in Phase P2, Bitcoin's decline was 2.69 times that of the S&P itself; quantile regression yields a left‑tail β of 2.391, or 2.2 times the median β. In downturns, it tracks most closely and falls most sharply.
When on-chain stablecoins experience rapid expansion, they become an endogenous asset within the crypto ecosystem, decoupling from U.S. equities, with a beta of –0.220 and charting their own trajectory. At such times, conventional macroeconomic analytical frameworks largely break down.
On ordinary days, when there are no obvious policy shocks, it occasionally serves as a canary for global risk appetite—its 24/7 pricing enables it to react to latent risks ahead of U.S. equities and the VIX, particularly during QE periods and in the P3 phase, where its Granger causality is statistically significant.
The four "faces" are not mutually exclusive; they coexist. Which one is "lit up" at any given moment depends on a host of state variables—volatility, market trends, the stability‑coin landscape, whether it's FOMC week, and more.
So the next time you hear, "The Fed has cut rates—BTC is about to rally," it's best to ask yourself three key questions first. First, has this rate cut already been priced into the market, and in which direction does the upside surprise lie? Second, how are traditional assets faring—has the bond market moved? Has the stock market reacted? And where does the VIX stand? Third, what's happening in crypto's own liquidity pool—are stablecoins expanding or contracting, and is on-chain sentiment hot or cold?
Structuring the analytical framework into four layers is far more useful than fixating on a single interest-rate button: signals of a tighter monetary policy first affect bonds and real interest rates, then shift equity risk appetite, followed by the direction of crypto‑specific liquidity, and only finally trickle down to BTC. Each layer can act as a bottleneck, introduce delays, or even reverse the intended transmission.
The question was asked incorrectly.
Over the past few years, everyone has been asking one question: Is BTC really a macro asset?
The question itself is phrased incorrectly.
The real question is: Under what conditions is BTC, and what kind of asset is it?
During the 2020 QE‑driven liquidity injection, it behaved like a liquidity‑driven risk asset, with a year‑over‑year correlation of 0.716 to M2, rising in tandem with monetary easing. In 2022, amid aggressive rate hikes, it became a high‑beta risk asset, correlated at 0.506 with the Nasdaq, moving in lockstep with interest rates; the 10‑year Treasury yield and real rates served as Granger‑causal leading indicators. Following its ETF launch in 2024, its pricing microstructure shifted: information dissemination accelerated, volatility subsided, yet it did not converge with the Nasdaq; instead, in 2025 it even exhibited a notable negative correlation with the index. By 2026, stablecoin liquidity within the crypto ecosystem had established a cointegrating relationship with it, yielding a year‑over‑year correlation of 0.743, while external macroeconomic beta and internal funding beta began to operate in parallel.
The reason the rate hike on September 16 did not trigger a typical, shock‑induced flash crash was not because BTC had decoupled from macro factors—according to the data in this paper, BTC's usual reaction pattern is never a sharp drop on FOMC day. If a genuine market response does occur, it tends to unfold gradually over the two weeks to a month following the event (which appears to be the case based on the current sample). More importantly, over the entire year leading up to the rate hike, the market had already been reminded by a 38% plunge that the simplistic "easing always leads to a rally" formula no longer holds. The fact that the September 16 scenario diverged from the old playbook underscores that the old framework had begun to lose its effectiveness a full year earlier.
BTC's beta is itself a variable. It is not a constant, nor a fixed label, and it does not follow a one-way trend of "becoming increasingly like U.S. equities." Rather, it is a function of the VIX, of its own price dynamics, of stablecoin conditions, and of institutional inflection points.
Methodologically, I did not rely solely on simple correlations. I employed event studies, local projections, Chow structural breaks, Baron–Kenny mediation analysis, Granger causality tests, cointegration tests, state‑dependent grouping, quantile regressions, and cross‑correlation functions—covering all the standard tools. For policy shocks, I used the daily change in the 2‑year U.S. Treasury yield on FOMC days as a daily‑frequency proxy, rather than the high‑frequency USMPD target/path factor; consequently, this measure may incorporate non‑pure policy components such as inflation expectations, term premiums, and information from press conferences. Moreover, FOMC statements are released at 2:00 p.m. Eastern Time, while Bitcoin trades 24/7, making it impossible for daily‑frequency data to precisely capture the high‑frequency, immediate market reactions following an announcement. With only 21 FOMC meetings since ETFs were introduced, the subsample size is relatively small. Additionally, we lacked access to daily ETF flow data and derivatives leverage measures. Mediation analyses can only reveal the direction of contemporaneous statistical relationships and cannot independently disentangle causal chains; cointegration does not imply causation; and Granger causality does not equate to "seeing the future." These limitations must be acknowledged upfront. Thus, this paper does not aim to demonstrate "what BTC has become"; rather, nine years of data point to one key insight: the once‑monolithic macroeconomic framework for Bitcoin no longer suffices to explain current realities.
The real challenge has never been predicting whether the Fed will raise or cut rates next. The real difficulty lies in figuring out how BTC will react when the next macro shock hits—will it be the last one in the parking lot to catch wind, only to get hit hardest? Or the canary that might chirp ahead of time? Or perhaps an independent market, buoyed by stablecoin expansion and completely unfazed by whatever the Fed is saying.
Understanding its current state is far more useful than memorizing the simplistic rule that "rate hikes lead to declines, rate cuts lead to gains."
Editor/rice